
Let's find the busiest day of the week in terms of emails:
counts = dfs.dayofweek.value_counts(sort=False)
counts.plot(kind='bar')
The output of the preceding code is as follows:
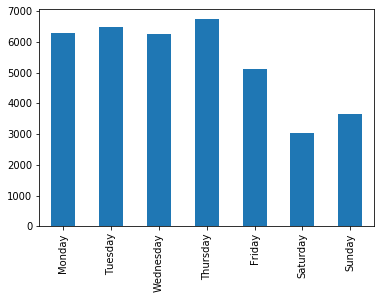
The preceding output shows that my busiest day is Thursday. I receive most of my emails on Thursdays. Let's go one step further and see the most active days for receiving and sending emails separately:
sdw = sent.groupby('dayofweek').size() / len(sent)
rdw = received.groupby('dayofweek').size() / len(received)

df_tmp = pd.DataFrame(data={'Outgoing Email': sdw, 'Incoming Email':rdw})
df_tmp.plot(kind='bar', rot=45, figsize=(8,5), alpha=0.5)
plt.xlabel('');
plt.ylabel('Fraction of weekly emails');
plt.grid(ls=':', color='k', alpha=0.5)
The output of the preceding code is as follows:
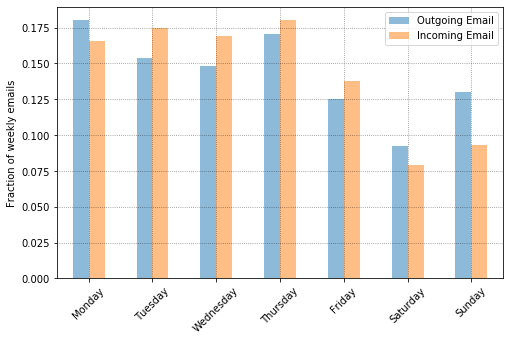
The output shown in the screenshot is pretty nice, right? Now, anyone can easily understand that my most active email communication days are Thursday for incoming emails and Monday for sending emails. That makes sense. I usually don't work on weekends, so, on Mondays, I always reply to my emails before starting the day. That is why on Monday, the analysis shows, I have more outgoing emails.
We can even go one level further. Let's find the most active time of day for email communication. We can do that easily. See the following code:
import scipy.ndimage
from scipy.interpolate import interp1d

plt.figure(figsize=(8,5))
ax = plt.subplot(111)
for ct, dow in enumerate(dfs.dayofweek.cat.categories):
    df_r = received[received['dayofweek']==dow]
    weights = np.ones(len(df_r)) / len(received)
    wfun = lambda x: weights
    plot_number_perdhour_per_year(df_r, ax, dt=1, smooth=True, color=f'C{ct}',
                      alpha=0.8, lw=3, label=dow, weight_fun=wfun)

    df_s = sent[sent['dayofweek']==dow]
    weights = np.ones(len(df_s)) / len(sent)
    wfun = lambda x: weights
    plot_number_perdhour_per_year(df_s, ax, dt=1, smooth=True, color=f'C{ct}',
                      alpha=0.8, lw=2, label=dow, ls='--', weight_fun=wfun)
ax.set_ylabel('Fraction of weekly emails per hour')
plt.legend(loc='upper left')
The output of the preceding code is as follows:

Sweet. The graph is a bit complex but still intuitive. From the previous graph, we noticed that my most active days were Monday (for outgoing emails) and Thursdays (for receiving emails). This graph shows that on Mondays, my active duration is between 09:00 AM and 12:00 PM. On Thursdays, my active duration is also between 9:00 AM and 12:00 PM. What are your most active hours based on your graph?