
Let's now clean our dataset for outliers:
- We can start by checking the shape of the dataset:
df_power.shape
The output of the preceding code is given here:
(4383, 5)
The dataframe contains 4,283 rows and 5 columns.
- We can also check few entries inside the dataframe. Let's examine the last 10 entries:
df_power.tail(10)
The output of the preceding code is given here:

- Next, let's review the data types of each column in our df_power dataframe:
df_power.dtypes
The output of the preceding code is given here:
Date object
Consumption float64
Wind float64
Solar float64
Wind+Solar float64
dtype: object
- Note that the Date column has a data type of object. This is not correct. So, the next step is to correct the Date column, as shown here:
#convert object to datetime format
df_power['Date'] = pd.to_datetime(df_power['Date'])
- It should convert the Date column to Datetime format. We can verify this again:
df_power.dtypes
The output of the preceding code is given here:
Date datetime64[ns]
Consumption float64
Wind float64
Solar float64
Wind+Solar float64
dtype: object
Note that the Date column has been changed into the correct data type.
- Let's next change the index of our dataframe to the Date column:
df_power = df_power.set_index('Date')
df_power.tail(3)
The output of the preceding code is given here:
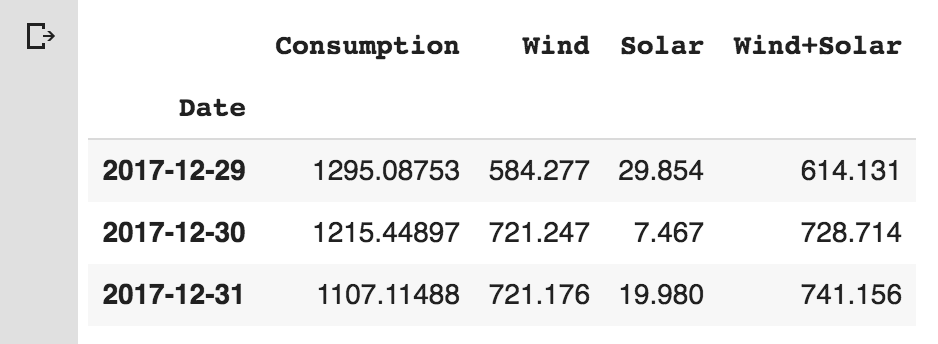
Note from the preceding screenshot that the Date column has been set as DatetimeIndex.
- We can simply verify this by using the code snippet given here:
df_power.index
The output of the preceding code is given here:
DatetimeIndex(['2006-01-01', '2006-01-02', '2006-01-03', '2006-01-04', '2006-01-05', '2006-01-06', '2006-01-07', '2006-01-08', '2006-01-09', '2006-01-10', ... '2017-12-22', '2017-12-23', '2017-12-24', '2017-12-25', '2017-12-26', '2017-12-27', '2017-12-28', '2017-12-29', '2017-12-30', '2017-12-31'],dtype='datetime64[ns]', name='Date', length=4383, freq=None)
- Since our index is the DatetimeIndex object, now we can use it to analyze the dataframe. Let's add more columns to our dataframe to make our lives easier. Let's add Year, Month, and Weekday Name:
# Add columns with year, month, and weekday name
df_power['Year'] = df_power.index.year
df_power['Month'] = df_power.index.month
df_power['Weekday Name'] = df_power.index.weekday_name
- Let's display five random rows from the dataframe:
# Display a random sampling of 5 rows
df_power.sample(5, random_state=0)
The output of this code is given here:

Note that we added three more columns—Year, Month, and Weekday Name. Adding these columns helps to make the analysis of data easier.