
When a dependent variable relies on several independent variables, the relationship can be captured using multiple linear regression. Multiple linear regression can be viewed as an extension of simple linear regression. When it comes to implementing multiple linear regression using sklearn, there is not much difference between simple and multiple linear regression:
- Simply include the extra columns in the X variable and run the code. So, let's include the additional columns for the X variable and follow the same code.
- Remember, a two-dimensional linear regression model is a straight line; it is a plane in three dimensions, and a hyperplane in over three dimensions:
# Preparing the data
X = df[['LSTAT','CRIM','NOX','TAX','PTRATIO','CHAS','DIS']]
y = df[['MEDV']]

# Splitting the dataset into train and test sets
from sklearn.model_selection import train_test_split
X_train, X_test, y_train, y_test = train_test_split(X, y, test_size = 0.3, random_state = 10)

# Fitting the training data to our model
regressor.fit(X_train, y_train)

#score of this model
regressor.score(X_test, y_test)
The output of this score() function is as follows:
0.6446942534265363
- Let's predict the y values with our model and evaluate it:
# predict the y values
y_pred=regressor.predict(X_test)
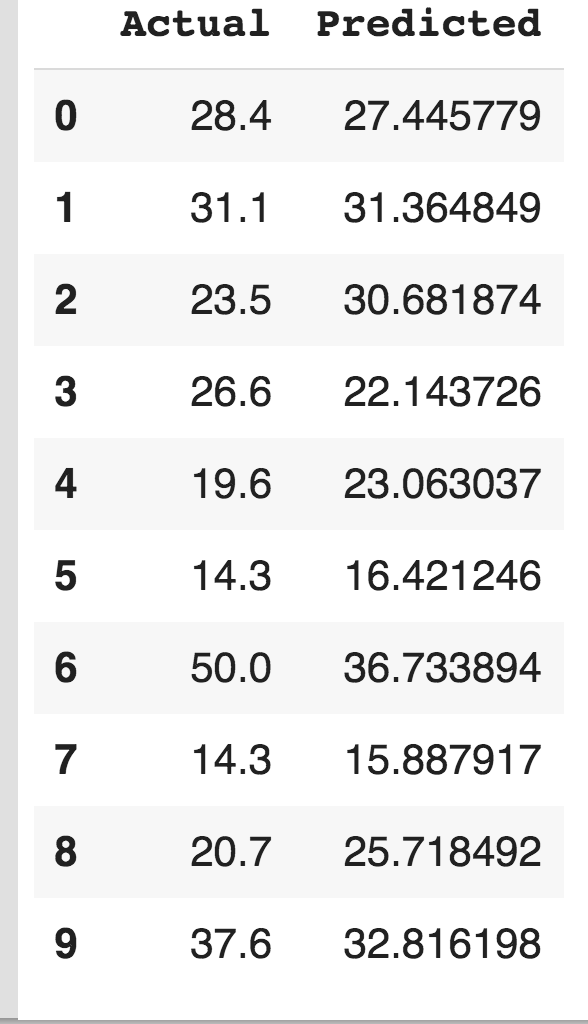
# a data frame with actual and predicted values of y
evaluate = pd.DataFrame({'Actual': y_test.values.flatten(), 'Predicted': y_pred.flatten()})
evaluate.head(10)
The target variables DataFrame is as follows:
- Let's make another multiple linear regression model with fewer features:
# Preparing the data
X = df[['LSTAT','CRIM','NOX','TAX','PTRATIO']]
y = df[['MEDV']]

# Splitting the dataset into train and test sets
from sklearn.model_selection import train_test_split
X_train, X_test, y_train, y_test = train_test_split(X, y, test_size = 0.3, random_state = 10)

# Fitting the training data to our model
regressor.fit(X_train, y_train)

#score of this model
regressor.score(X_test, y_test)
The output of this score() function is as follows:
0.5798770784084717
The accuracy of this model is 57%. The table below shows the actual and predicted value for the target variable MEDV for this built model is as follows:
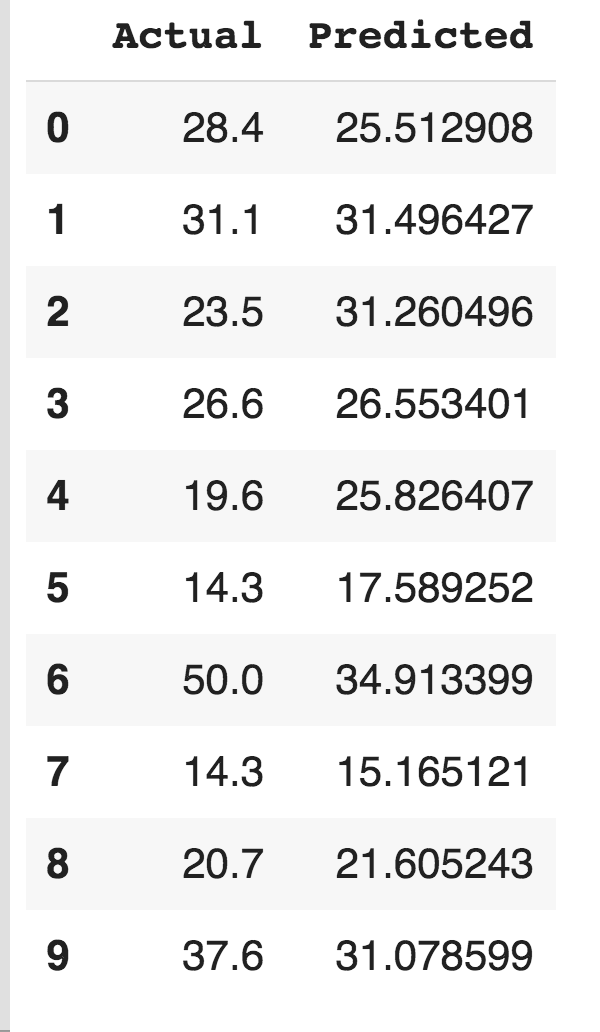
As you can see, changing the features in X will make a change in the accuracy of the model. So you must analyze the correlation among the features carefully and then use them to build the model with greater accuracy.