
The uniform probability distribution function of any continuous uniform distribution is given by the following equation:

Let's plot the graph for uniform distribution using the Python libraries, seaborn and matplotlib. First of all, let's import the important libraries needed to generate the graph:
import matplotlib.pyplot as plt
from IPython.display import Math, Latex
from IPython.core.display import Image
import seaborn as sns

sns.set(color_codes=True)
sns.set(rc={'figure.figsize':(10,6)})
Now, let's generate a uniform distribution:
from scipy.stats import uniform
number = 10000
start = 20
width = 25

uniform_data = uniform.rvs(size=number, loc=start, scale=width)
axis = sns.distplot(uniform_data, bins=100, kde=True, color='skyblue', hist_kws={"linewidth": 15})
axis.set(xlabel='Uniform Distribution ', ylabel='Frequency')
The code is pretty obvious, right? We simply import the uniform function from the stats library and generate the data. Once we generate the dataset, we plot the graph. The output graph of the preceding code is as follows:
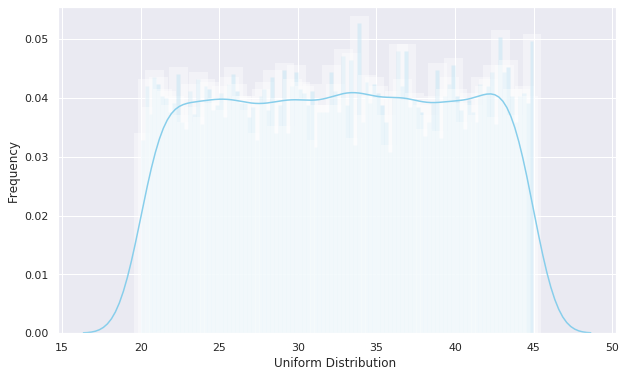
The uniform function is used to generate a uniform continuous variable between the given start location (loc) and the width of the arguments (scale). The size arguments specify the number of random variates taken under consideration. The graph illustrates the fact that the dataset is uniformly distributed.