
A process in which some events occur continuously and independently at a constant average rate is referred to as a Poisson point process. The exponential distribution describes the time between events in such a Poisson point process, and the probability density function of the exponential distribution is given as follows:

We can visualize an exponentially distributed random variable using the scipy.stats module by applying the expon.rvs() function. Check the following code:
# Exponential distribution
from scipy.stats import expon

expon_data = expon.rvs(scale=1,loc=0,size=1000)
axis = sns.distplot(expon_data, kde=True, bins=100, color='skyblue', hist_kws={"linewidth": 15})
axis.set(xlabel='Exponential Distribution', ylabel='Frequency')
The output of the preceding code is as follows:
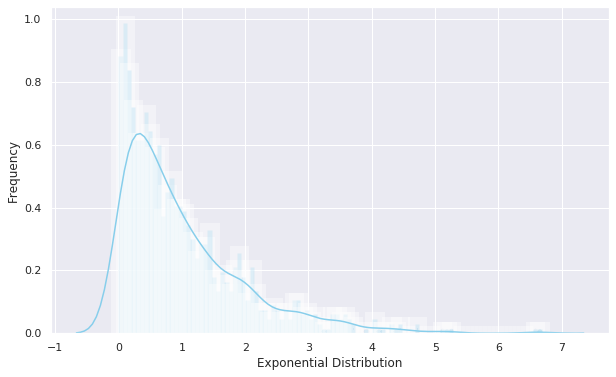
The graph shown in the preceding diagram illustrates the decreasing exponential function. The curve is decreasing over the x axis.