
The pandas.pivot_table() function creates a spreadsheet-style pivot table as a dataframe. The levels in the pivot table will be stored in MultiIndex objects (hierarchical indexes) on the index and columns of the resulting dataframe.
The simplest pivot tables must have a dataframe and an index/list of the index. Let's take a look at how to do this:
- Let's make a pivot table of a new dataframe that consists of the body-style, drive-wheels, length, width, height, curb-weight, and price columns:
new_dataset1 = df.filter(["body-style","drive-wheels",
                          "length","width","height","curb-weight","price"],axis=1)
#simplest pivot table with dataframe df and index body-style
table = pd.pivot_table(new_dataset1, index =["body-style"])
table
The output of the preceding code is as follows:
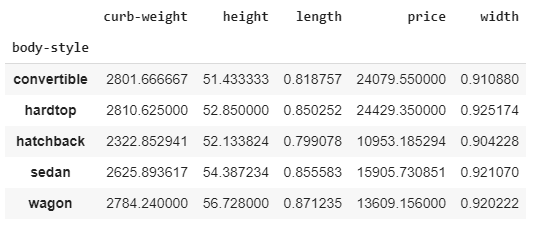
The output table is similar to how we group a dataframe with respect to body-style. The values in the preceding table are the mean of the values in the corresponding category. Let's make a more precise pivot table.
- Now, design a pivot table with the new_dataset1 dataframe and make body-style and drive-wheels as an index. Note that providing multiple indexes will make a grouping of the dataframe first and then summarize the data:
#pivot table with dataframe df and index body-style and drive-wheels
table = pd.pivot_table(new_dataset1, index =["body-style","drive-wheels"])
table
The output of the preceding code is as follows:

The output is a pivot table grouped by body-style and drive-wheels. It contains the average of the numerical values of the corresponding columns.
The syntax for the pivot table takes some arguments, such as c, values, index, column, and aggregation function. We can apply the aggregation function to a pivot table at the same time. We can pass the aggregation function, values, and columns that aggregation will be applied to, in order to create a pivot table of a summarized subset of a dataframe:
# import numpy for aggregation function
import numpy as np

# new data set with few columns
new_dataset3 = df.filter(["body-style","drive-wheels","price"],axis=1)

table = pd.pivot_table(new_dataset3, values='price', index=["body-style"],
                       columns=["drive-wheels"],aggfunc=np.mean,fill_value=0)
table
In terms of syntax, the preceding code represents the following:
- A pivot table with a dataset called new_dataset3.
- The values are the columns that the aggregation function is to be applied to.
- The index is a column for grouping data.
- Columns for specifying the category of data.
- aggfunc is the aggregation function to be applied.
- fill_value is used to fill in missing values.
The output of the preceding code is as follows:

The preceding pivot table represents the average price of cars with different body-style and available drive-wheels in those body-style.
- We can also apply a different aggregation function to different columns:
table = pd.pivot_table(new_dataset1, values=['price','height','width'],
                       index =["body-style","drive-wheels"],
                       aggfunc={'price': np.mean,'height': [min, max],'width': [min, max]},
                       fill_value=0)
table
The output of the preceding code is as follows:

This pivot table represents the maximum and minimum of the height and width and the average price of cars in the respective categories mentioned in the index.