
We can customize the pandas dataframe with another technique called cross-tabulation. This allows us to cope with groupby and aggregation for better data analysis. pandas has the crosstab function, which helps when it comes to building a cross-tabulation table. The cross-tabulation table shows the frequency with which certain groups of data appear. Let's take a look:
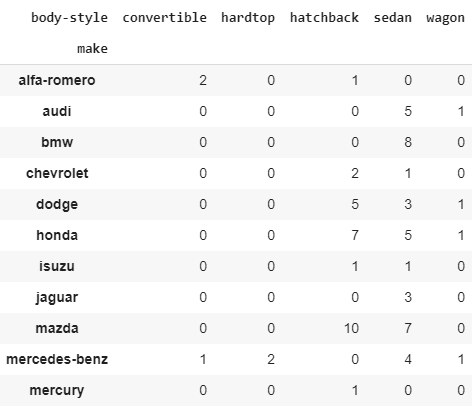
- Let's use pd.crosstab() to look at how many different body styles cars are made by different makers:
pd.crosstab(df["make"], df["body-style"])
The output of the preceding code is as follows:
Let's apply margins and the margins_name attribute to display the row-wise and column-wise sum of the cross tables, as shown in the following code:
# apply margins and margins_name attribute to displays the row wise
# and column wise sum of the cross table
pd.crosstab(df["make"], df["body-style"],margins=True,margins_name="Total Made")
The output of the preceding code is as follows:

Applying multiple columns in the crosstab function for the row index or column index or both will print the output with grouping automatically.
- Let's see how the data is distributed by the body-type and drive_wheels columns within the maker of car and their door type in a crosstab:
pd.crosstab([df["make"],df["num-of-doors"]], [df["body-style"],df["drive-wheels"]],
            margins=True,margins_name="Total Made")
The output of the preceding code is as follows:

Now, let's rename the column and row index. Renaming gives us a better understanding of cross-tabulation, as shown in the following code:
# rename the columns and row index for better understanding of crosstab
pd.crosstab([df["make"],df["num-of-doors"]], [df["body-style"],df["drive-wheels"]],
            rownames=['Auto Manufacturer', "Doors"],
            colnames=['Body Style', "Drive Type"],
            margins=True,margins_name="Total Made").head()
The output of the preceding code is as follows:

These were some cross-tabulation examples that gave us the frequency distributions of data in the respective categories.
The pivot table syntax of pd.crosstab also takes some arguments, such as dataframe columns, values, normalize, and the aggregation function. We can apply the aggregation function to a cross table at the same time. Passing the aggregation function and values, which are the columns that aggregation will be applied to, gives us a cross table of a summarized subset of the dataframe.
- First, let's look at the average curb-weight of cars made by different makers with respect to their body-style by applying the mean() aggregation function to the crosstable:
# values are the column in which aggregation function is to be applied
# aggfunc is the aggregation function to be applied
# round() to round the output

pd.crosstab(df["make"], df["body-style"],values=df["curb-weight"],
            aggfunc='mean').round(0)
The output of the preceding code is as follows:

A normalized crosstab will show the percentage of time each combination occurs. This can be accomplished using the normalize parameter, as follows:
pd.crosstab(df["make"], df["body-style"],normalize=True).head(10)
The output of the preceding code is as follows:

Cross-tabulation techniques can be handy when we're trying to analyze two or more variables. This helps us inspect the relationships between them.