
The next step is to extract the keywords from the title. There are several ways we can extract keywords. Here, we are going to use the TfidfVectorizer utility method provided by the sklearn.feature_extraction module. Let's get started:
- To use the library, we need to import the essential libraries:
from sklearn.feature_extraction.text import TfidfVectorizer
from sklearn.cluster import MiniBatchKMeans
from sklearn.decomposition import PCA
from sklearn.manifold import TSNE
- Next, let's learn how to extract the keywords:
tfidf = TfidfVectorizer(
   min_df = 5,
    max_df = 0.95,
    max_features = 8000,
    stop_words = 'english'
)
tfidf.fit(df.Title)
text = tfidf.transform(df.Title)
In the preceding code, we are converting the title into TF-IDF features. We are removing the stop words from the title.
If you understood the concept of clustering, you probably already understand one of the biggest challenges surrounding the clustering; that is, determining how many clusters there are is optimal. There are some algorithms that can help us in determining the best number of clusters. One such algorithm is the elbow method (https://www.scikit-yb.org/en/latest/api/cluster/elbow.html).
Let's create a function that takes the text and the maximum number of clusters and plot them on a graph. The code for doing so is as follows:
def generate_optimal_clusters(data, max_k):
    iters = range(2, max_k+1, 2)

    sse = []
    for k in iters:
        sse.append(MiniBatchKMeans(n_clusters=k, init_size=1024, batch_size=2048, random_state=20).fit(data).inertia_)
        print('Fitting {} clusters'.format(k))

    f, ax = plt.subplots(1, 1)
    ax.plot(iters, sse, marker='o')
    ax.set_xlabel('Cluster Centers')
    ax.set_xticks(iters)
    ax.set_xticklabels(iters)
    ax.set_ylabel('SSE')
    ax.set_title('SSE by Cluster Center Plot')

generate_optimal_clusters(text, 20)
Note the following points regarding the preceding function:
- It takes two arguments, the text and the maximum number of clusters. In this case, we assume that the maximum number of clusters is 20.
- Next, inside the function, we call the fit() method on the MiniBatchKMeans cluster for a range from 2, to the maximum number of clusters allowed (2 to 20).
- For each cluster, we calculate the sum of squared error (SSE) plot on the graph.
The output of the preceding code is as follows:
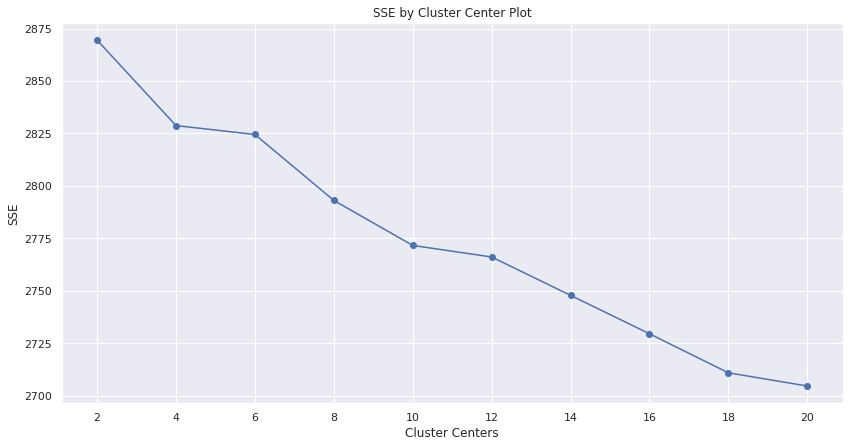
As shown in the preceding plot, the elbow changes at 4. According to the elbow theory, the plot creates an elbow at the optimal cluster number. Hence, the best cluster, in this case, is 4.