
A bubble plot is a manifestation of the scatter plot where each data point on the graph is shown as a bubble. Each bubble can be illustrated with a different color, size, and appearance.
Let 's continue using the Iris dataset to get a bubble plot. Here, the important thing to note is that we are still going to use the plt.scatter method to draw a bubble chart:
# Load the Iris dataset
df = sns.load_dataset('iris')

df['species'] = df['species'].map({'setosa': 0, "versicolor": 1, "virginica": 2})

# Create bubble plot
plt.scatter(df.petal_length, df.petal_width,
            s=50*df.petal_length*df.petal_width,
            c=df.species,
            alpha=0.3
            )

# Create labels for axises
plt.xlabel('Septal Length')
plt.ylabel('Petal length')
plt.show()
The bubble chart generated by the preceding code is as follows:
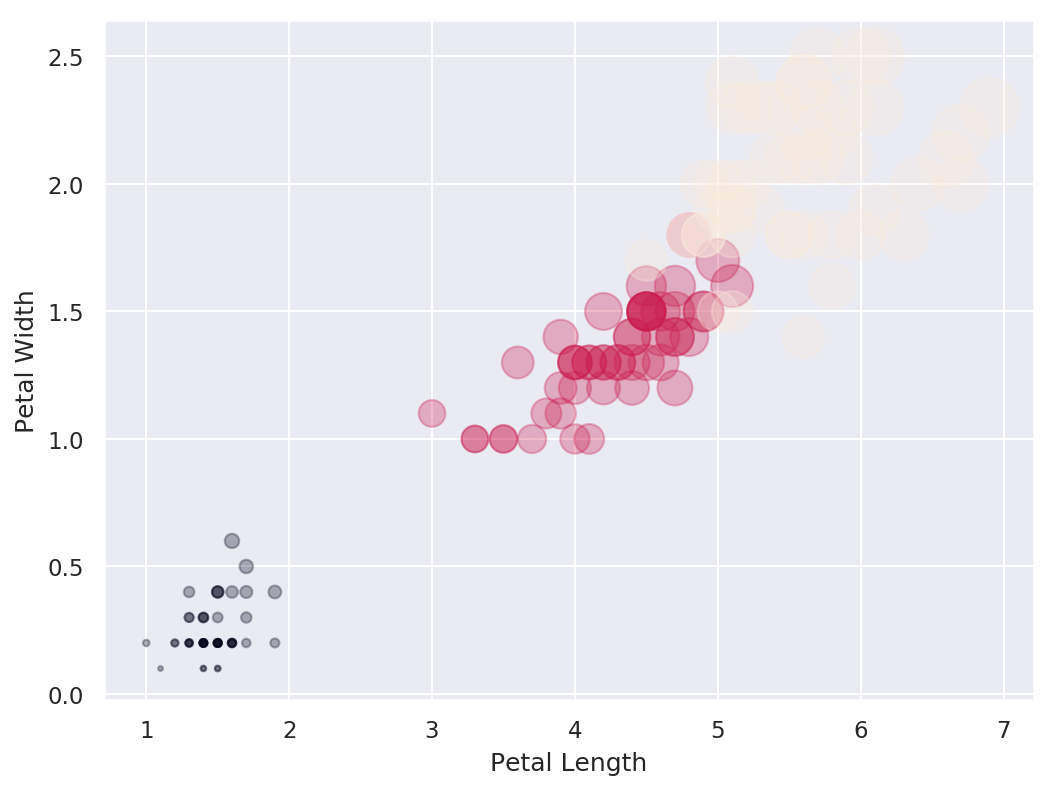
Can you interpret the results? Well, it is not clear from the graph which color represents which species of Iris. But we can clearly see three different clusters, which clearly indicates for each specific species or cluster there is a relationship between Petal Length and Petal Width.