
A scatter plot can also be generated using the seaborn library. Seaborn makes the graph visually better. We can illustrate the relationship between x and y for distinct subsets of the data by utilizing the size, style, and hue parameters of the scatter plot in seaborn.
Get more detailed information about the parameters from seaborn's documentation website: https://seaborn.pydata.org/generated/seaborn.scatterplot.html.
Now, let's load the Iris dataset:
df = sns.load_dataset('iris')

df['species'] = df['species'].map({'setosa': 0, "versicolor": 1, "virginica": 2})
sns.scatterplot(x=df["sepal_length"], y=df["sepal_width"], hue=df.species, data=df)
The scatter plot generated from the preceding code is as follows:
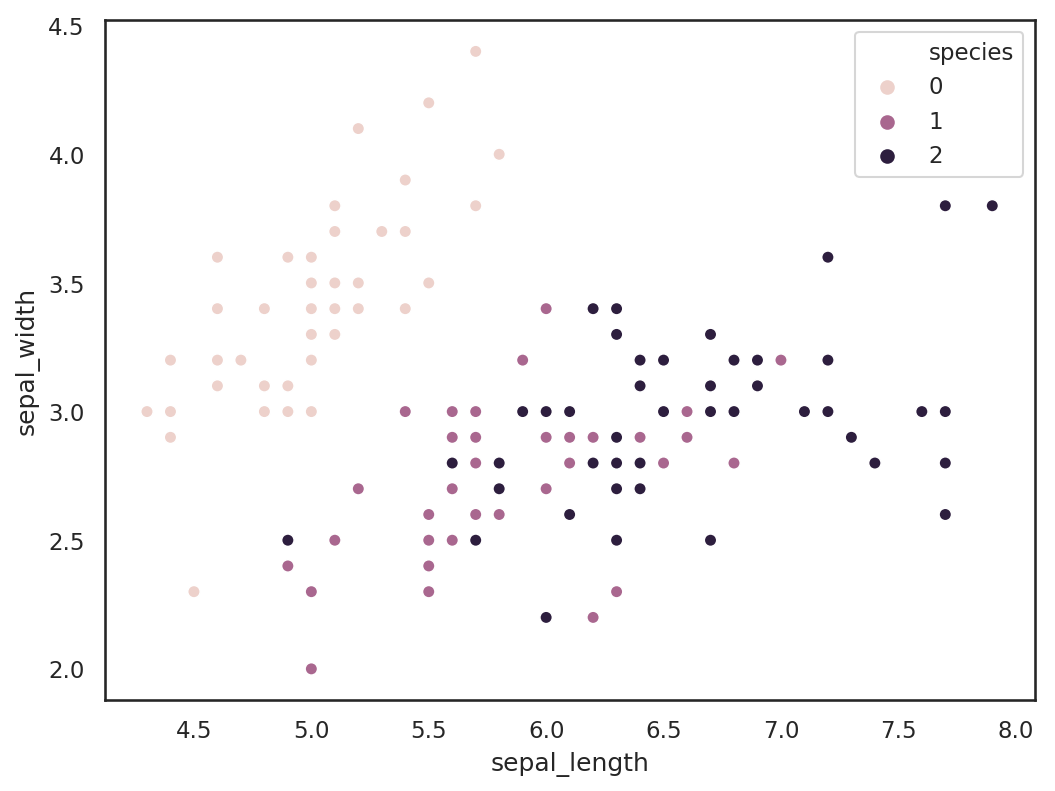
In the preceding plot, we can clearly see there are three species of flowers indicated by three distinct colors. It is more clear from the diagram how different specifies of flowers vary in terms of the sepal width and the length.