
Reports can be run directly from SSRS or within the OpsMgr console from the Reporting and Administration workspaces. Using the console to run reports should be the preferred option for most people as it adds a more user-friendly graphical layer on top of the SSRS Report Manager.
For example, clicking on the name of a report from within the Reporting workspace will present you with a Report Details pane (shown in Figure 10.39) giving you information on what the report can do and for more complicated reports, it gives details on how to actually run them.
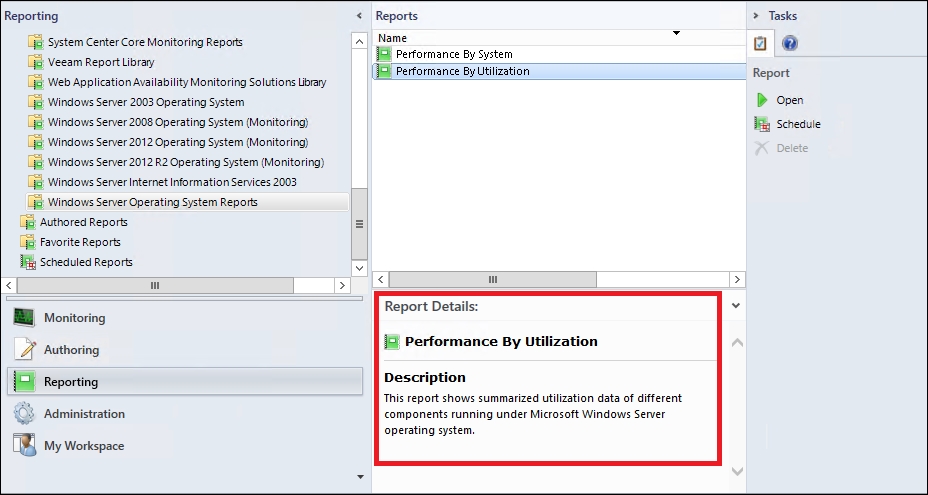
Figure 10.39: Viewing details about a selected report
Having this detailed information to hand is really useful when you're trying to understand which report is best suited to your requirements and to save time troubleshooting, we recommend reading through the Report Details section of every report before you run it.
Blank reports is the most common problem you'll encounter when working with the Reporting feature in OpsMgr. The solution to this problem is understanding the type of objects and classes that the report is configured to return data on and some reports are easier than others to get right on the first attempt thanks to some built-in help from the vendors that created the original report definition.
An example of easy to run reports are the ones that come bundled with the Windows Server Operating System management pack. Follow these steps to run a report on operating system performance (this process assumes that you've deployed the Windows Server Core Operating System management packs):
- Open the Reporting workspace, click on the Windows Server 2012 R2 Operating System (Monitoring) folder from the navigation bar, as shown in Figure 10.40, select the Windows Server 2012 R2 Operating System Performance report, read the information in the Report Details pane and then click on Open from the Tasks menu on the right.
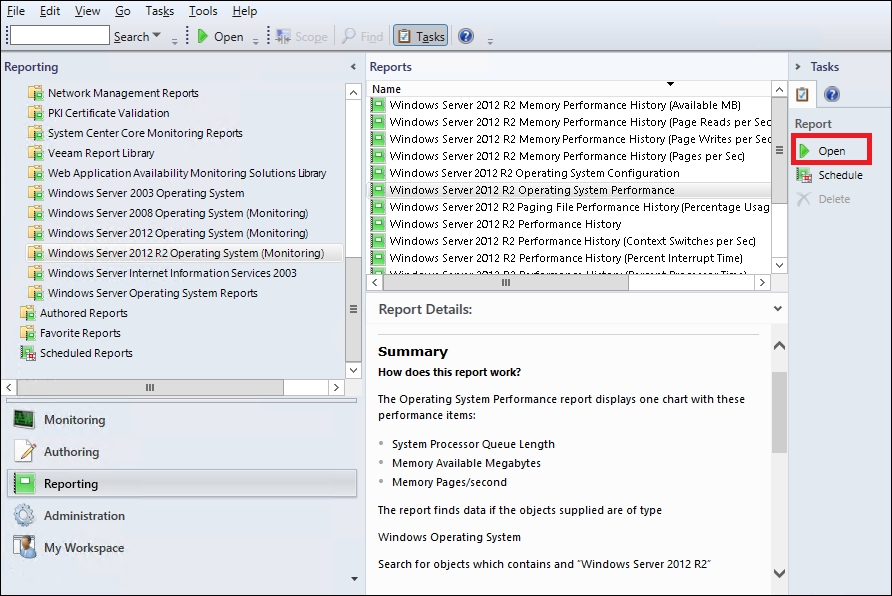
Figure 10.40: Selecting a report to open
- With the report open, click on the Add Object button to open the dialog box and notice the Filter Options have been applied warning message here. This is a useful feature that indicates the object search has been filtered to include objects of a specific class. Clicking the Options button will show you the type of class that's been filtered – shown for this report in Figure 10.41. Click on OK to go back to the Add Object dialog box.

Figure 10.41: Displaying filter options for a report
- At the Object Name field, click on the Search button to display all monitored Windows Server class instances, add a server (or servers) to the Selected Objects section using the Add button and click on OK to close the dialog box and return to the main report parameter area.
- Similar to Figure 10.42, choose a timeframe for the report duration by changing the From and To fields on the left - we've used the Advanced option to offset the number of days with a minus value of 5 days.
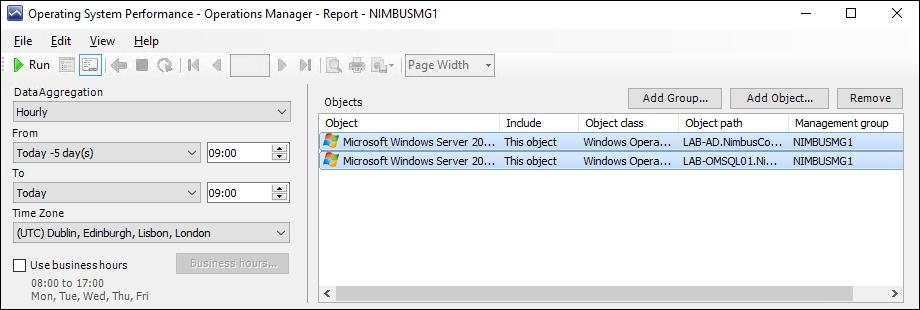
Figure 10.42: Configuring the report duration and other parameters
- Click on Run to render the report and you should be presented with something similar to the one shown in Figure 10.43.

Figure 10.43: Viewing the report.
The great thing about using the console to run and view reports is that you can quickly pivot from one report to another to help you dive deeper for your analysis requirements. With some reports, you can also navigate to scoped console views relevant to the contents of the report and these views enable you to see the current performance and availability data (as opposed to historic data from the report) of your monitored objects.
To identify a linked report, hover your mouse pointer over the blue text link (usually this will be the name of a rule, instance or object) in the original report and the mouse pointer should change to an icon of a hand. If it does, just click on this link to open the new report.
In Figure 10.44 you can see the Memory Available Megabytes Windows Server 2012 R2 linked report that we launched from our original Windows Server 2012 R2 Operating System Performance report simply by clicking on the name of the performance rule – which is colored with blue text and located in the Rule, Instance, or Object column.
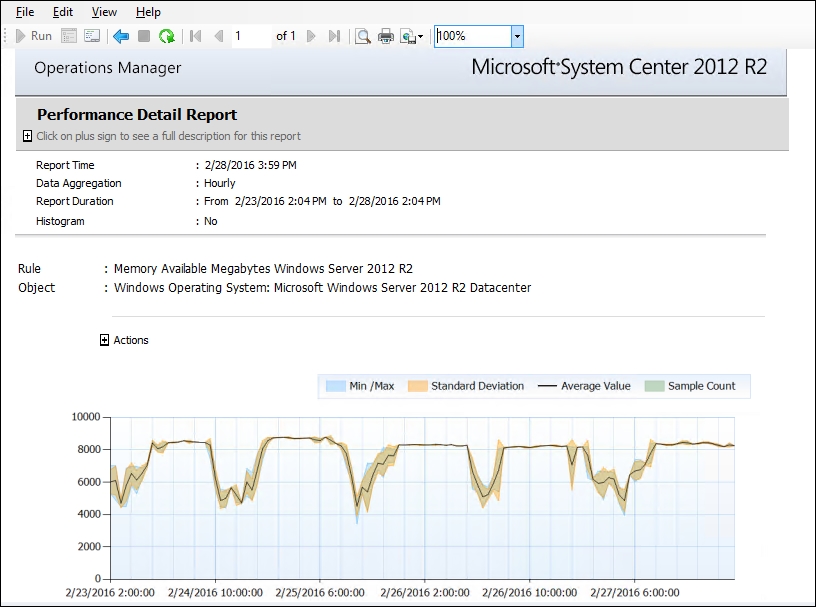
Figure 10.44: Pivoting to a linked report
If the report you are viewing has an Actions section, click on the plus symbol to expand and see the additional reports and console views that are available to you as shown in Figure 10.45.

Figure 10.45: Viewing available Actions from a report
Try clicking on any of the links the Actions section presents to you and you'll see how you can drill down even further for additional 'here and now' monitoring data from linked reports and views.
A good tip to avoid blank reports is to run reports from the Monitoring workspace. Just like when views and tasks change to reflect the type of object you've selected from the Monitoring workspace, you will find that a number of contextual reports will appear in the Tasks pane on the right. When you run these reports, they will automatically populate with the class and object that you have selected – therefore ensuring you get valid data returned in the report.
Here's how you can run a targeted Windows Server Operating System report from the Monitoring workspace:
- Open the Monitoring workspace, browse to and expand the Microsoft Windows Server management pack folder on the left, click on the Windows Server Operating System State view and select a monitored server from the central pane. As you can see in Figure 10.46, the list of reports presented changes to reflect some reports relevant to the class of the object you've selected – in our case the Windows Server Operating System class. Click on the Windows Server 2012 R2 Operating System Performance report to open the parameters for it.

Figure 10.46: Targeted reports from the Monitoring workspace
- Now when the report parameters section in Figure 10.47 opens, you'll notice that the object you selected from the previous state view is automatically populated into the Objects pane with the correct class for the report.

Figure 10.47: Automatically populated Objects pane from a targeted report.
- Once here, you can modify the time range and other parameters for the report before running it. When the report runs it will then be presented in the same way as if you ran the report directly from the Reporting workspace. The only difference is that you've saved yourself a few steps by not needing to manually add objects and change filter options.
Considering the amount of time some reports might take you to configure and get right, it's a good thing that there's a handy option to save your reports for future configuration or testing. All you have to do to save a report is to first configure the report, then run it from the console. After the report has run, click on the File menu and choose the Save to favorites option as shown in Figure 10.48.
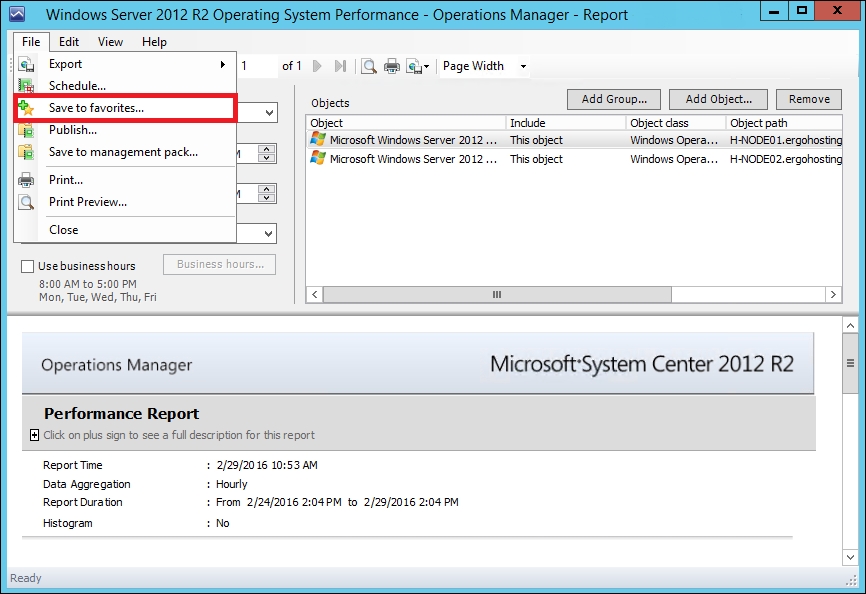
Figure 10.48: Saving a report
The saved report can now be viewed and managed from the Favorite Reports folder – which is located in the Reporting workspace and shown in Figure 10.49.
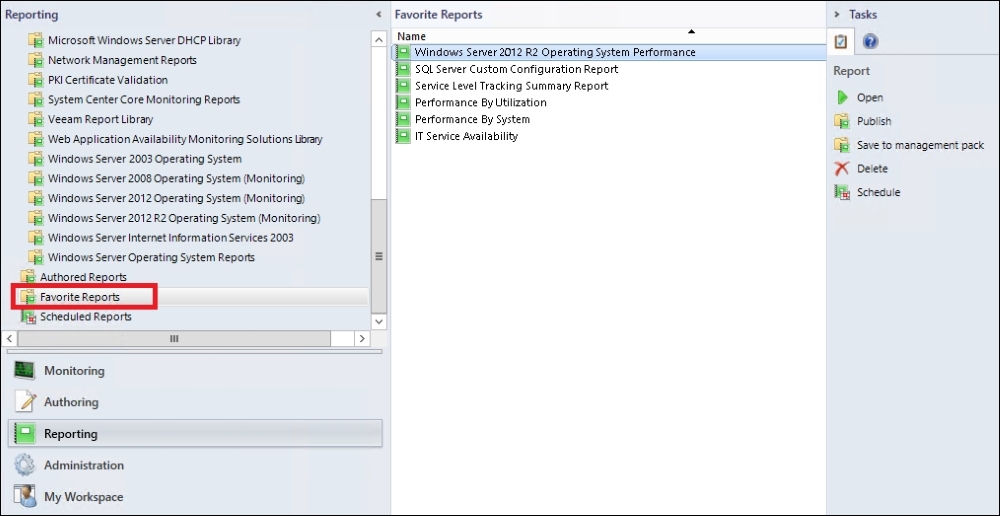
Figure 10.49: Accessing the Favorite Reports folder
Tip
Reports saved to the Favorite Reports folder are accessible only by the user account that was used to save them there. If you wish to make a report accessible to other users, you will need to either schedule the report for delivery to them or you can publish the report to the Authored Reports folder.
A query that comes up quite a bit on the OpsMgr TechNet forums is how to access the Reporting workspace from the OpsMgr Web console. The short answer is you can't access this workspace with the Web console – even with an OpsMgr administrator account.
There is a workaround however. If you save reports to your Favorite Reports folder in the full console, the next time you open the Web console, you will find those saved reports in the My Workspace area under the Favorite Reports view similar to Figure 10.50.
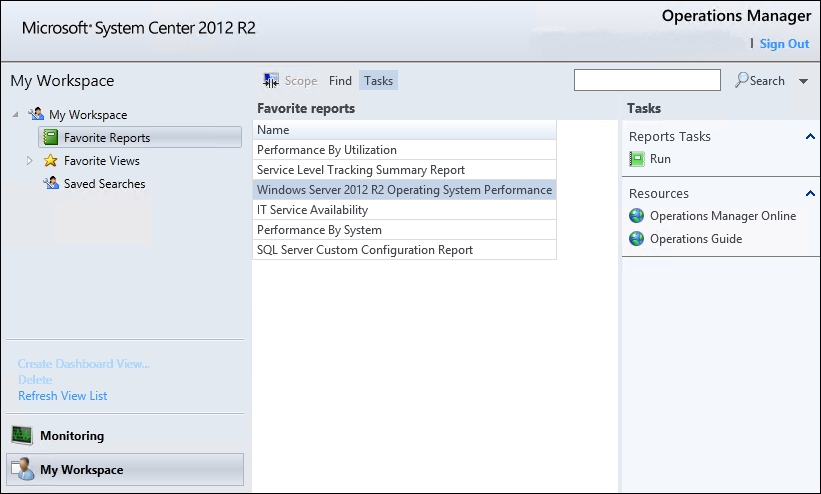
Figure 10.50: Accessing reports from the Web console
From here, you can simply select a saved report and hit the Run link on the right to open it. Working with reports through the Web console is limited though and you won't have the option to modify any report parameters like the Report Duration times. These changes still need to be made through the full console and saved again for them to reflect back in the Web console.
When you have created the report you need and want to view it in a format other than that of the OpsMgr console, you can use the Export option from the File menu. In Figure 10.51, you can see the different report formats available to you and when you choose a format, you will be presented with a Save As dialog box – where you can give the exported report a name and choose a location to save it to.
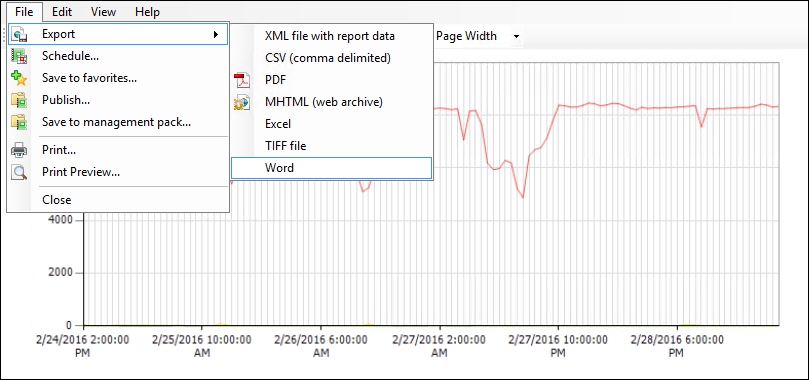
Figure 10.51: Exporting a report to a different format
Tip
Using the Export option is a great way to get an understanding of how a report will look before you schedule it to be delivered to users via e-mail. This has proven to be a good validation point for us in the past as the PDF format doesn't always present reports the way you'd expect them to look and we can then check what it looks like as a Word or Excel file instead.
If you're using the Web console to view your saved reports, you can also export to different formats there by clicking on the Export button shown in Figure 10.52.

Figure 10.52: Exporting from the Web console
The advantage of using the Reporting capability of OpsMgr is that you don't need to give everyone access to the consoles so they can get a view of how the IT infrastructure is behaving. Instead we can create reports with the relevant information and then schedule them for delivery to go out to all concerned parties for consumption.
Here's all you need to do to schedule a report for delivery:
- Run the report from the Reporting workspace in the console and ensure that it's returning the type of information that you want your users to see. When you're happy with the content of the report, click on File and select the Schedule option from the drop-down menu to launch the Subscribe to a Report wizard.
- At the Delivery Settings dialog box (shown in Figure 10.53), type a name for the report into the Description field and select E-Mail from the Delivery method drop-down menu. For the e-mail settings, enter the e-mail addresses that should receive the report and change the other options as required. Click on Next to move on.
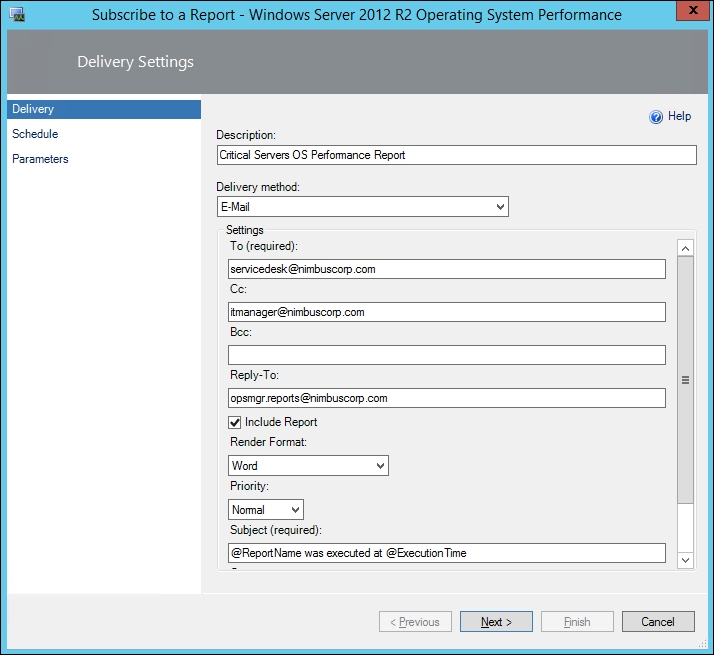
Figure 10.53: Scheduling a report
- At the Schedule dialog box, choose a schedule (once-off, hourly, daily, weekly or monthly) and an effective beginning time to use with this report subscription, then click on Next to continue.
- The Report Parameters dialog box shown in Figure 10.54 presents the original parameters that you specified when running the report initially and you have a choice to leave these as they are or modify them to your needs.

Figure 10.54: Modifying parameters for the scheduled report
- Click on Finish to create the new report subscription and browse to the Scheduled Reports folder in the Reporting workspace to confirm the report is ready to go. In Figure 10.55 you can see the report we've just scheduled and when you click on the report, the Report Subscription Details pane will give you details about the schedule and execution status. This information is useful when troubleshooting non-delivery of scheduled reports.
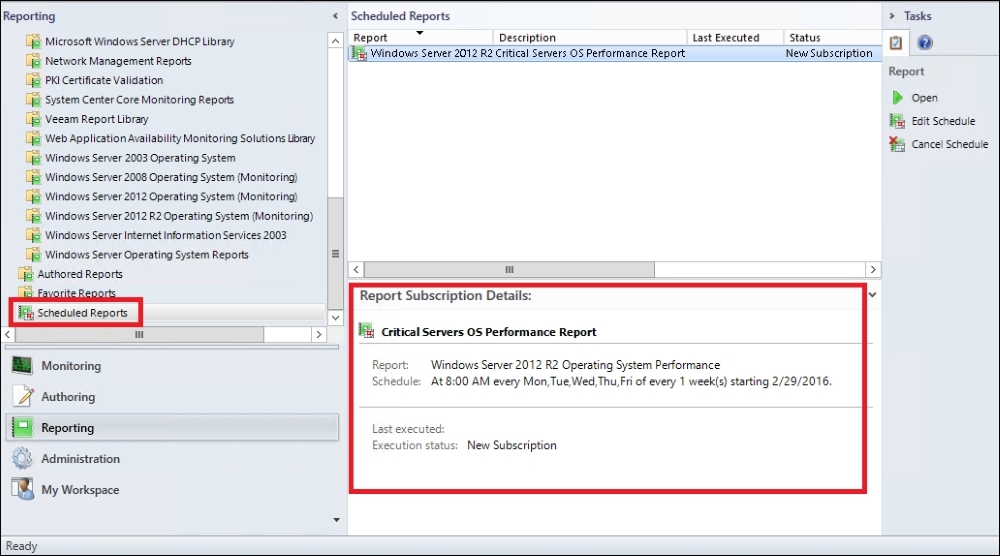
Figure 10.55: Reviewing the scheduled report subscription details
If you create or modify a report in the Reporting workspace and want to make that report available to other users then there is an option to publish the report to SQL Reporting Services where you can then make it visible to everyone else.
Here's what you need to do:
- Run the report from the Reporting workspace in the console and ensure that it's returning the type of information that you want your users to see. When you're happy with the content of the report, click on File and select the Publish option from the drop-down menu.
- Enter a name and description for the published report and click on OK.
- Browse to the Authored Reports folder and confirm that your published report is listed as shown in Figure 10.56.
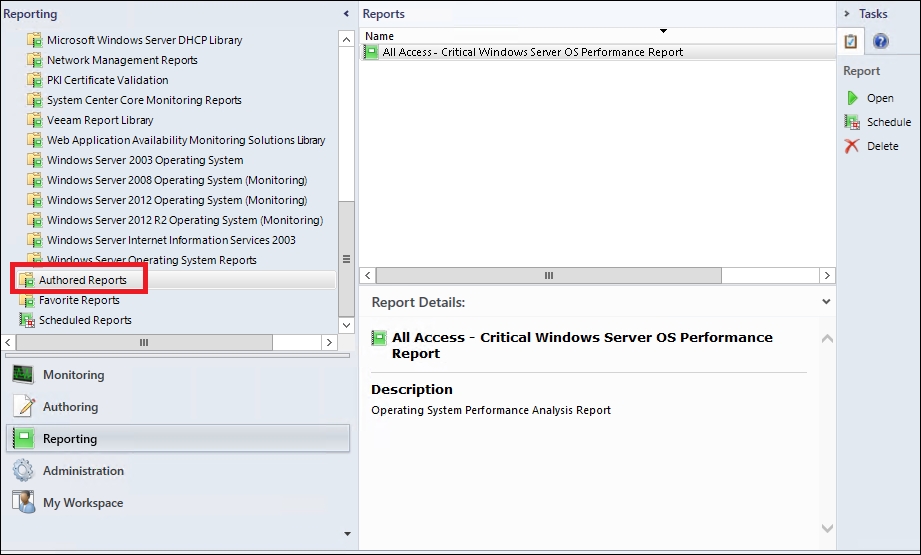
Figure 10.56: Authored reports in the console
- Now open a web browser, browse to your SSRS Report Manager URL and from the home page, use the New Folder button to create a new folder named
OpsMgr Authored Reports. - Back at the Home page, click on the My Reports folder to open it and you should see the report that you published earlier in OpsMgr similar to Figure 10.57.

Figure 10.57: Viewing your published report in SSRS
- Move your mouse pointer over the report and then click on the arrow to show the drop-down menu. From there, select the Move option, choose the newly created OpsMgr Authored Reports folder as the move location and click on OK to move the published report.
- Open the Reporting workspace again in the OpsMgr console and hit F5 on your keyboard to refresh the list of report folders. You should now see the new OpsMgr Authored Reports folder in the list and when you select this folder, you'll see the published report available for all users as shown in Figure 10.58.
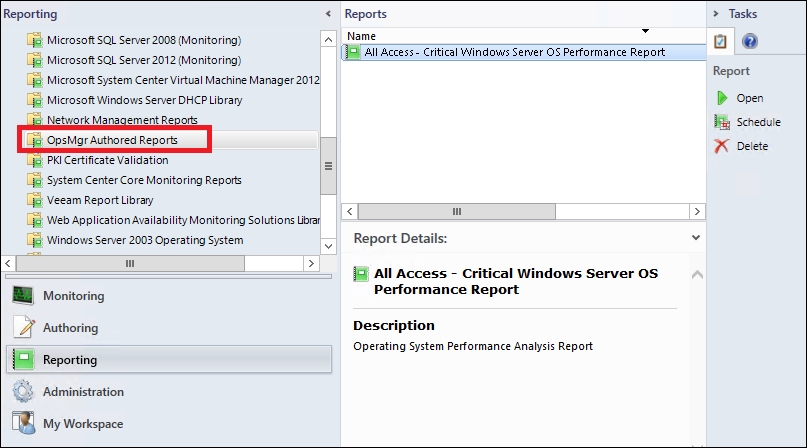
Figure 10.58: Making authored reports available to all users