
With the best will in the world and no matter how well you manage your OpsMgr environment, there's inevitably going to be times when you run into problems. In the following sections we'll show you some management packs, tools and reports that can be used to aid troubleshooting and we'll also cover a few of the more common issues that you might encounter.
A lot of people working with OpsMgr tend to underestimate the usefulness of one of the very first management packs that gets deployed into their management groups during installation – the Operations Manager management pack.
This management pack is an excellent starting point to go to when you're having problems with any of your management servers, gateways, agents and even network devices. In Figure 11.25 you can see the abundance of views and dashboards it offers to help gain a better understanding of the health and performance of your monitoring environment.

Figure 11.25: The Operations Manager management pack
If you've ever encountered the problem of incorrect health states on roll-up monitors when using the Health Explorer or a diagram view, then you'll appreciate what the System Center Internal Task Library management pack can do for you.
An incorrect health state for a roll-up monitor typically means that the parent roll-up monitor shows an unhealthy state but the child monitors are all healthy – similar to the roll-up monitor shown in Figure 11.26.
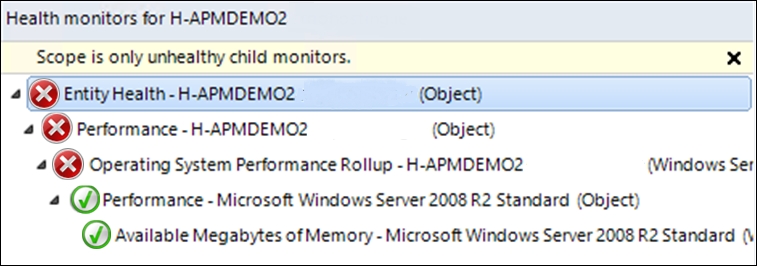
Figure 11.26: Incorrect roll-up monitor health state
Putting the object into Maintenance Mode for a few minutes is a workaround that normally resolves this problem. However, if you import the System Center Internal Task Library management pack from the SupportTools directory on your OpsMgr installation media (shown in Figure 11.27), then you'll have access to some new tasks in the console, one of which will help you resolve the incorrect roll-up monitor problem without using Maintenance Mode as a workaround.
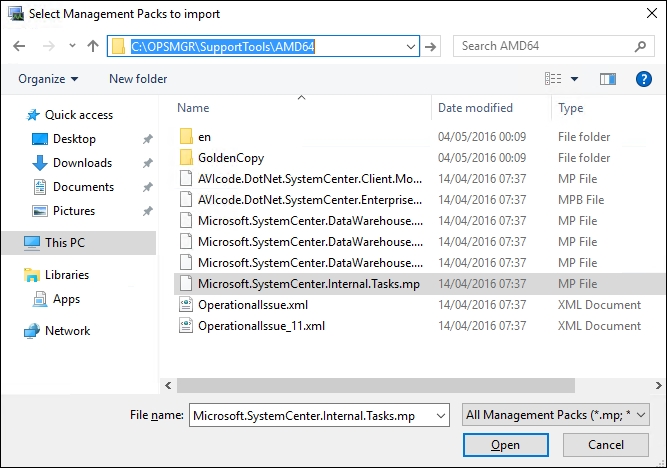
Figure 11.27: Importing the Internal Task Library management pack
In Figure 11.28 you can see the four new tasks this management pack has to offer and the highlighted Resubmit local cache state change events task can be run against the entity that contains the incorrect roll-up monitor, which should then force a recalculation of its health state and return the monitor to its proper state.
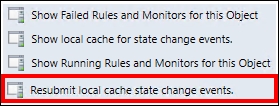
Figure 11.28: Tasks in the Internal Task Library management pack
Tip
Microsoft's Daniel Mueller wrote a detailed post on this management pack a few years back that contains additional information and examples for the other three tasks. Check it out here - http://tinyurl.com/opsmgrfixrollup
Agents are the lifeblood of your monitoring environment as they tirelessly work behind the scenes – constantly querying monitored computers and passing all that useful data back to the management servers so it can be easily consumed as alerts and dashboards in the console. If an agent stops communicating with OpsMgr (and the monitored computer is still online), you'll need to understand where to go to get it back online sooner rather than later.
When an agent stops communicating with OpsMgr you will usually see from the console that it has changed to a gray health state with the icon and health display name also showing its last known state before the communication problem (shown here in Figure 11.29).
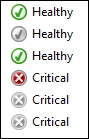
Figure 11.29: Gray state agents showing their last known health
The first and most obvious thing that you'll want to check when you notice a gray state agent is to confirm that the computer is actually powered up and contactable across the network (a quick Ping check will do for this). You should also confirm that the Microsoft Monitoring Agent (healthservice.exe) is still installed on the computer and that the agent control panel applet is present and has the correct references for your management group.
If the agent is still installed, open the Operations Manager log in Windows Event Viewer on the computer and then restart the Microsoft Monitoring Agent service. This should generate a number of events in the log that might point you to a reason why communications are down.
You should also check to confirm that TCP port 5723 is still contactable on the management server from the agent. Use a telnet command to check this port is open and also verify there are no firewall devices blocking communication of this port.
When you've worked through all of the obvious steps to try and get the agent to communicate again but it still remains in a gray state, it's time to clear the agent cache and force it to request a new configuration in the same way it would after the agent has been installed initially.
Here's how you can clear the agent cache:
- Logon to the server that has the gray state agent, launch the
services.mscsnap-in and stop the Microsoft Monitoring Agent service (HealthService). - Now use Windows Explorer and browse to
C:Program FilesMicrosoft Monitoring AgentAgentHealth Service Stateand delete theHealth Service Storefolder, as shown in Figure 11.30.
Figure 11.30: Clearing the agent health cache
- When you've deleted the folder, restart the Microsoft Monitoring Agent service again and the Health Service Store folder will be recreated with newly requested configuration. Check the Operations Manager event log again as the agent is restarting and you should see events indicating the gray agent come back to life and has started to communicate.
Tip
Microsoft has put together a very useful article for troubleshooting gray health states on agents with a number of different scenarios and solutions to work from. You can get more information from this link - https://support.microsoft.com/en-us/kb/2288515
From time to time we come across agent communication problems when the Microsoft Monitoring Agent is deployed to domain controllers and even after working through all of the steps we've previously mentioned, the agent still remains in a gray state.
A common reason we've found for this is related to the Local System account that the OpsMgr agent normally uses for monitoring the domain controller. This account can sometimes be denied access (depending on security hardening policies) and to resolve the issue we need to use the Health Service Lockdown (HSLockdown) tool that comes bundled as part of the agent installation.
You can use the HSLockdown tool to check if the local system account is blocked or not and if it is, then you can also use it to enable access again so the agent can continue monitoring. Follow these steps to verify access has been blocked:
- On the domain controller with the gray agent state, launch a command prompt with an account that has administrative access and browse to
C:Program FilesMicrosoft Monitoring AgentAgent. - Type
hslockdown /Land hit Enter on your keyboard to get a list of all the accounts that are allowed and denied. As you can see in Figure 11.31, the NT AUTHORITYSYSTEM account is denied access and this is what's causing our gray agent state.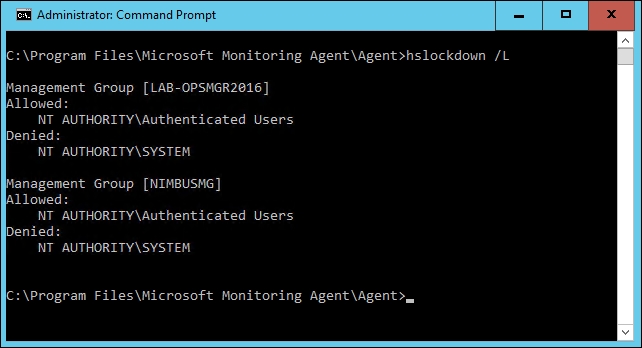
Figure 11.31: Using the HSLockdown tool to view permissions
- To grant this account permission for monitoring, type
hslockdown /A "NT AuthoritySystem"and hit Enter. In Figure 11.32 you can see that this account is now granted permissions to communicate and you are prompted to restart the health service to apply the changes.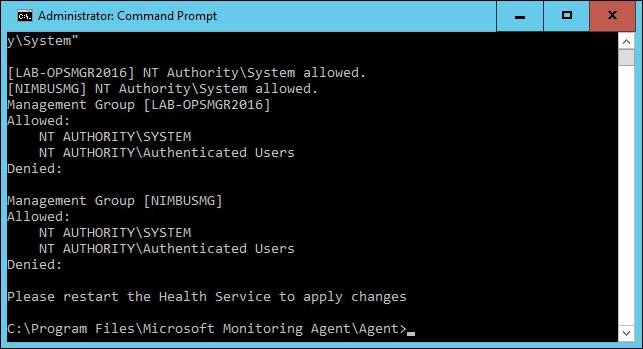
Figure 11.32: Granting permissions with HSLockdown
- When the agent restarts it should come out of a gray state and return to normal (you may need to refresh your console view to see the new health state).
When troubleshooting issues with your OpsMgr infrastructure, it's useful to have a look over some of the default reports in the Reporting workspace, which target the management group, databases and agents - as they can contain a lot of useful information that might otherwise take you a while to track down manually.
Some examples of useful database troubleshooting reports can be found in the Microsoft Data Warehouse Reports folder shown in Figure 11.33.
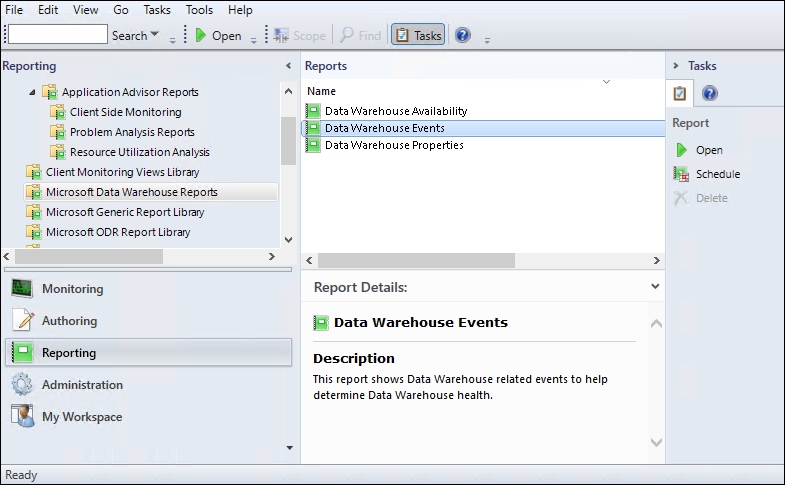
Figure 11.33: Data warehouse reports
The availability and events reports are self-explanatory and provide information that can be used to assist with outages and performance problems. The Data Warehouse Properties Report shown in Figure 11.34 gives you a handy breakdown of the various datasets hosted within the database.
These are the same datasets we worked with earlier when grooming the data warehouse with the dwdatarp.exe tool.

Figure 11.34: Viewing the Data Warehouse Properties report
The Microsoft ODR Report Library shown in Figure 11.35 contains some other useful reports based around alerts, management pack versions, overrides and management group information.
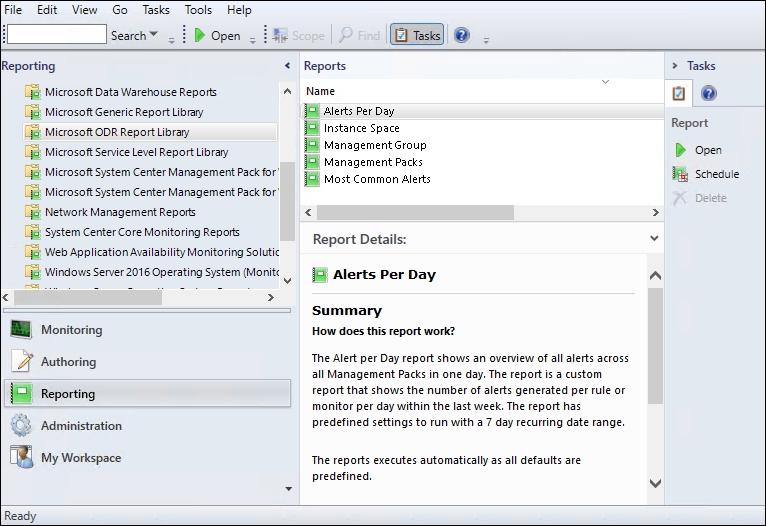
Figure 11.35: Microsoft ODR Report Library
Finally, the System Center Core Monitoring Reports library shown in Figure 11.36 is where you can go to get information about agent count and health states, management pack data volumes and the amount of data generated by workflows and instances.
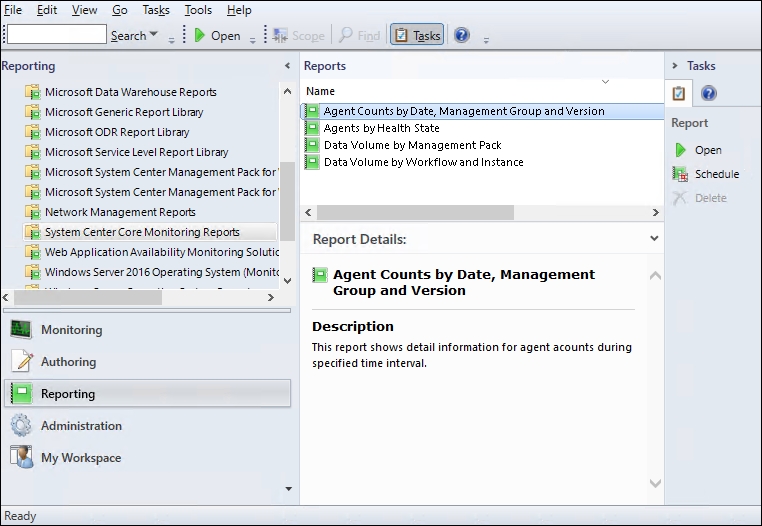
Figure 11.36: System Center Core Monitoring Reports library
The Agent Counts by Date, Management Group and Version report shown in Figure 11.37 is beneficial in larger organizations when you're trying to get a handle on the number of agents that are running an older version and which could ultimately cause communication problems.

Figure 11.37: Agent Counts by Date, Management Group and Version report