
The final steps you need to work through when you have your distributed application and service level objectives created is to make them easily visible (and manageable) from within the Monitoring workspace. By adding a few simple views to the management pack folder that contains the distributed application, administrators and operators who plan on using the OpsMgr consoles for monitoring will reap the benefits.
It's worth pointing out before we begin that the views we create in this section are just suggestions to get you started and you can go ahead and add whatever works for you or your customer environments as applicable.
The first view we will create is a Diagram view so we can get a visual representation of the IT service and its child component groups.
- In the Monitoring workspace, right-click on the location that you wish to create your new view (we'll choose the 001 – Demo IT Service management pack folder we created earlier in the Modeling Your IT Service section), click on New, and then click on Diagram View.
- In the Name field, type a name for your distributed application diagram view – we'll choose 'Demo IT Service' as a name here.
- Click the Browse button to open the Object Search dialog box.
- From the Look for drop-down menu, choose the Service class and then type the name of the distributed application and hit Search. Now select the distributed application from the Available Items section, click on Add, and then hit OK to open the Create Diagram View dialog box.
- Select the Create your own template option and click on the Create button to build your diagram view. The end product should look similar to the distributed application in Figure 7.39.

Figure 7.39: Viewing the service model diagram.
The next view that we want to create is an alert view, which will be scoped directly at our new distributed application. Using a view like this makes it easy for IT service owners to see all alerts that are specific to the service they are responsible for.
- In the Monitoring workspace, right-click on the folder location that contains your distributed application (this should be the same folder you used in the previous section), click on New and then click on Alert View.
- In the Name field, type a name for your view – we'll use 'Demo IT Service Alerts' for our example.
- At the Criteria tab, define the parameters of your alert view:
- On the Show Data Related To box, click on the ellipsis button (…), select the View All Targets option, type the name of your distributed application into the Look For field, select the distributed application from the list and click on OK.
- In the Show Data Contained In A Specific Group box, leave the (All) groups option selected.
- From the Select Conditions area, select the check boxes for the alert criteria that you wish to show in the view; we've chosen a criterion that specifies all alerts except those with a resolution state of Closed.
- Click the Display tab and as shown in Figure 7.40, add an additional column to display here for Repeat Count and change the Group items by option to Descending.

Figure 7.40: Viewing the service model diagram
- Click OK when you're done to complete the Alert view.
The last distributed application view that we will add is the SLA view. This is a dashboard template designed to show service level objectives and it can be configured to show single or multiple objectives as required.
Here's what you need to do to create an SLA view for your distributed application:
- In the Monitoring workspace, right-click on the folder location that contains your distributed application (this should be the same folder you used in the previous sections), click on New, and then click on Dashboard View.
- At the New Dashboard and Widget Wizard, select the Service Level Dashboard option shown in Figure 7.41 then click on Next to move on.
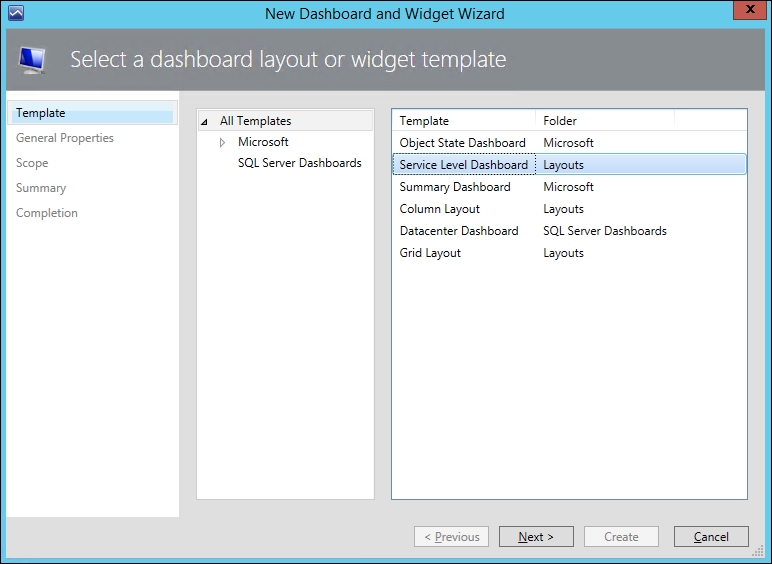
Figure 7.41: Creating a service level dashboard
- Give the dashboard a name (we'll use 'Demo IT Service SLA' here) and click on Next to continue.
- From the Specify the Scope dialog box, click on the Add button to open the Add SLA dialog box.
- In the Available Items list, locate the SLA you created earlier in the Creating service level objectives section, add it to Selected Items and click on OK to close the dialog box.
- You should now see your SLA listed in the Specify the Scope dialog box and here you can choose the time period that the SLA will report back on. In Figure 7.42, you can see that we've chosen a 24 hour period but you can select from minutes, hours, days, months and years as required.
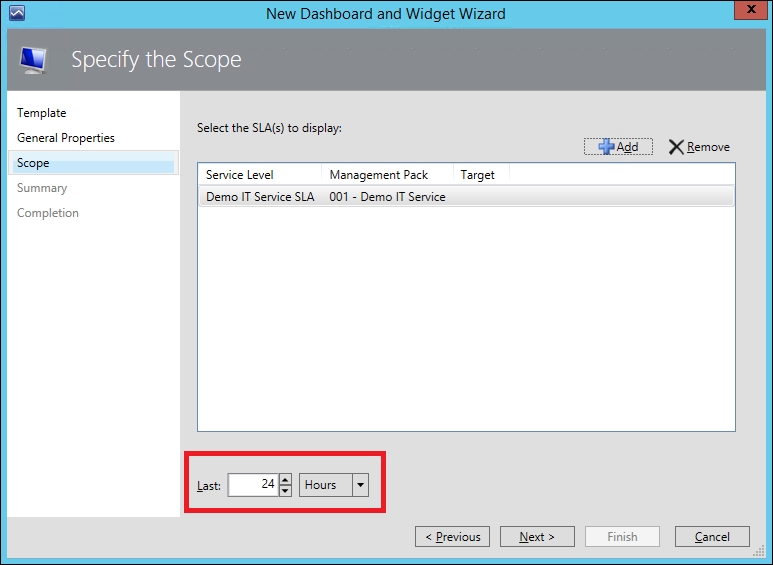
Figure 7.42: Selecting a time period for your SLA
- When you're ready, click on Next to move on and then at the Summary dialog box, hit Create to complete the wizard, and you should end up with a dashboard similar to the one in Figure 7.43.
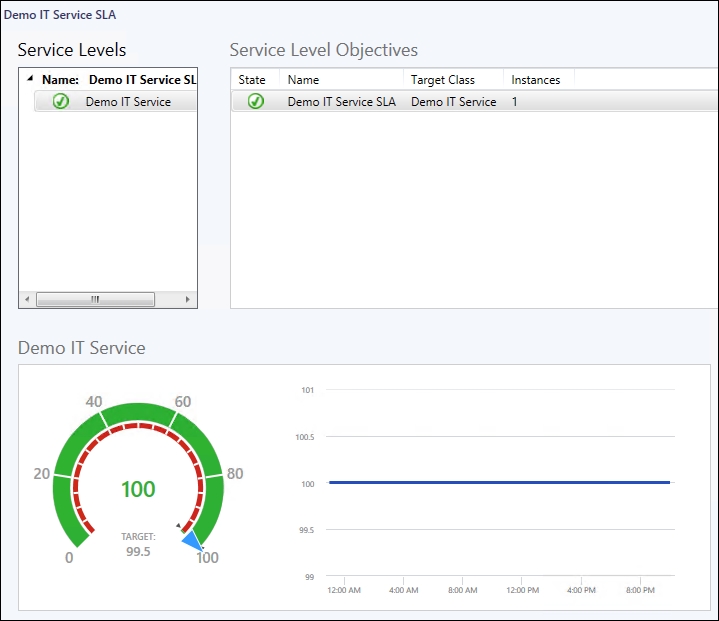
Figure 7.43: SLA dashboard view