
In the Working with Views section of Chapter 3, Exploring the Consoles we walked you through creating an Alert view and highlighted the benefit of configuring the Repeat Count column to help you quickly identify alerts generated by rules that had a high repeat count. Although this view can be useful for identifying alerts generated by rules, it's not as easy to identify alerts generated by monitors as a small number of monitors can also potentially have a repeat count value (where those monitors have their AutoResolve value set to False).
The Alert Widget is a view that you can use within a dashboard layout to clearly identify which alerts were generated by monitors.
The following steps will help you first create an empty dashboard layout from where you will then create the Alert Widget view:
- In the Monitoring workspace, right-click where you want to create the new view, click on New, and then click on Dashboard View.
- Choose a dashboard layout style from the Select a dashboard layout or widget template dialog box. We'll choose the Grid Layout as shown in Figure 8.16. Click on Next to continue.
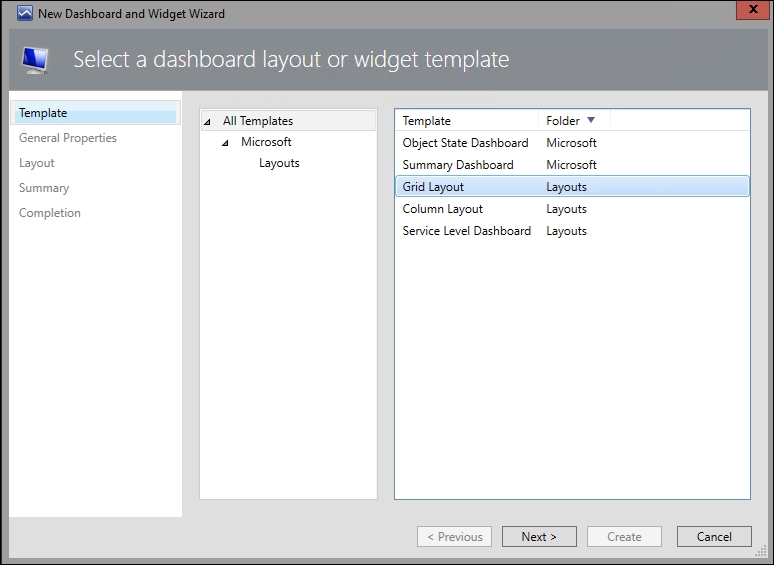
Figure 8.16: Choosing the Grid Layout dashboard
- In the Name field, type a name to identify the view – we'll use 'Tuning Assistance Dashboard' for our example.
- In the Specify the layout of the dashboard dialog box, select the number of cells that you wish to have in your dashboard. We'll go with 1 Cell as shown in Figure 8.17. Click on Next to move on.
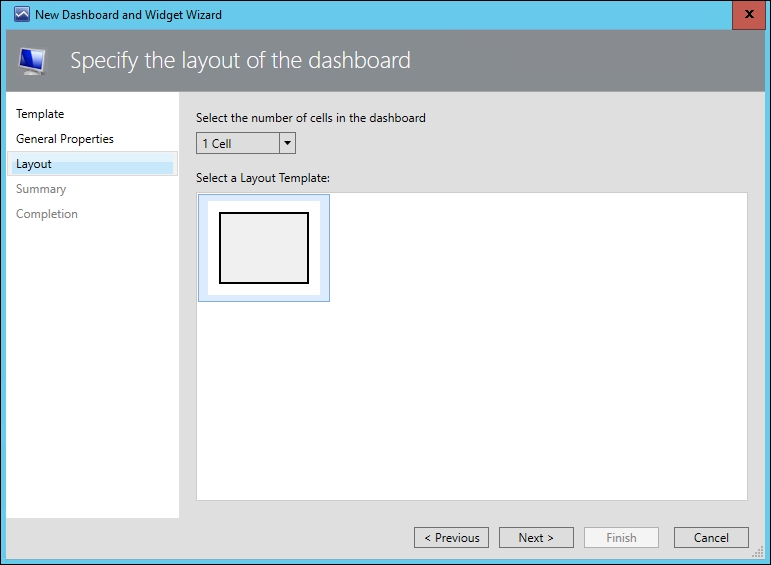
Figure 8.17: Choosing a single-cell layout
- Confirm your settings at the Summary dialog box, and then hit the Create button to create the new dashboard layout. Click on the Close button to complete the creation of the dashboard layout.
Now that you have your dashboard layout created, the following steps will walk you through adding a new Alert Widget:
- From the single-cell grid dashboard layout that you've just created, select the link titled Click to add widget… and here, you'll be presented with the New Dashboard and Widget Wizard shown in Figure 8.18. Choose the Alert Widget, and then click on Next to move on.
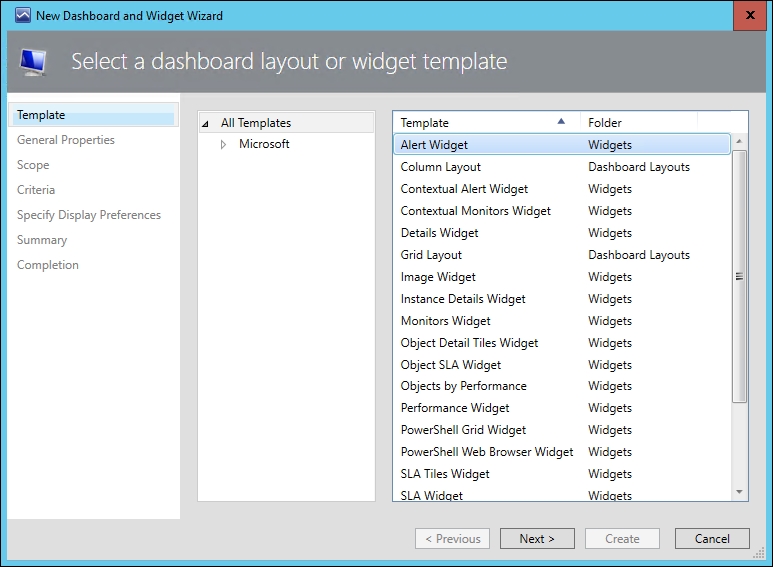
Figure 8.18: Selecting the Alert Widget
- In the Name field, type a name to identify the widget and click on Next to continue.
- In the Specify the Scope dialog box, leave the default scope set to (All) and hit Next to move on.
- From the Specify the Criteria dialog box, you can optionally scope the alerts by priority, severity or resolution state, and then click on Next when you're ready to continue.
- Now, the Display dialog box that you see here is where the 'secret sauce' lives for this view. In the Columns to display section, you will see an optional column titled Is Monitor Alert. This column is only available as an option when you use the Alert Widget from within a dashboard and Figure 8.19 shows how we've configured this for our example (you can use the blue arrow buttons to move the Is Monitor Alert column up the list so it's easier to view later).
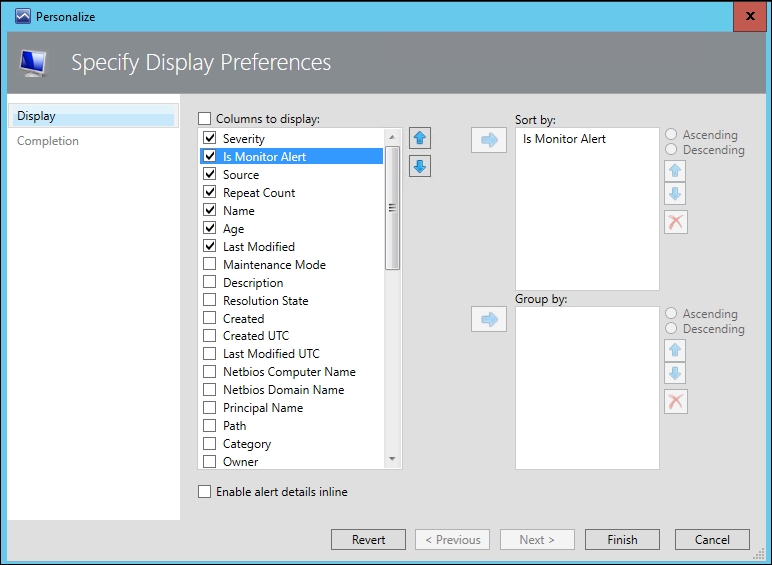
Figure 8.19: Enabling the 'Is Monitor Alert' column
- Click on Next to move on, and then hit the Create button to create the new view. With the new Alert Widget view created, you should be presented with a view similar to our example shown in Figure 8.20.
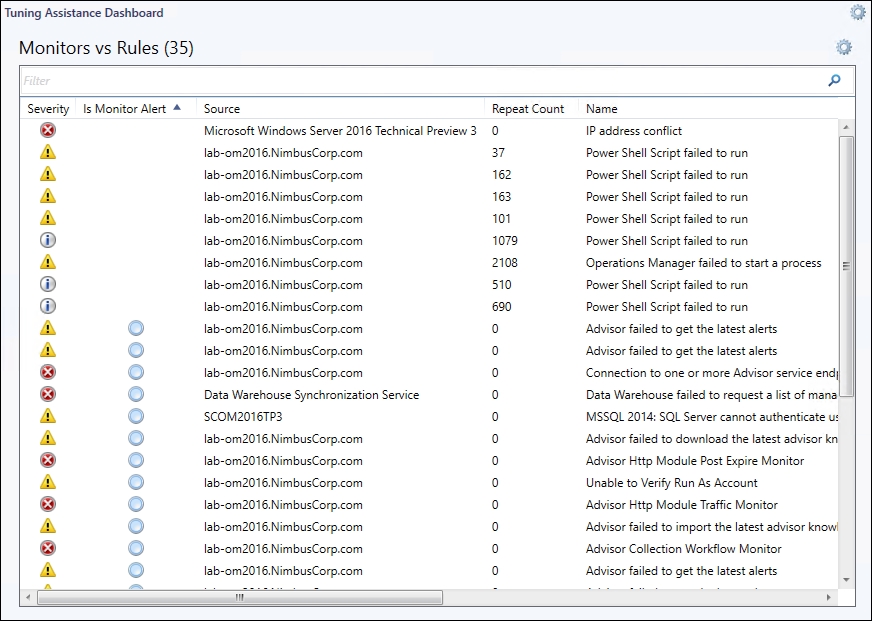
Figure 8.20: Viewing alerts generated by monitors
- In this view, you can see that any alerts generated by a monitor are listed in the Is Monitor Alert column with a blue circle icon beside them. Any alerts with no blue icon beside them in this column have been generated by rules and they have an associated repeat count value beside them. Optionally, you can click on any column name to sort it in ascending or descending order to show your monitors or rules at the top or bottom of the view.
This type of view can come in very handy when you have a large number of alerts in your console and you want to get a quick overview of which alerts have been generated by monitors and which ones have been generated by rules.