
When network devices have been discovered, you can see a list of them from the Network Devices view under Network Management in the Administration workspace as shown in Figure 6.10.
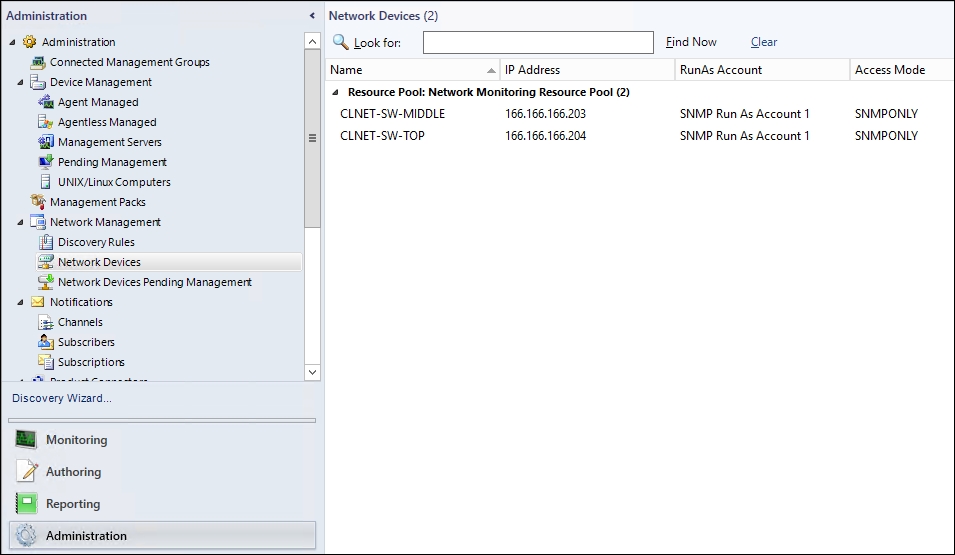
Figure 6.10: Viewing a list of discovered network devices
If you've configured the DNS resolution for your network devices, you'll see a DNS name listed alongside the IP address, the Run As account, and access mode used by the discovery rule. Although this information is useful, managing network devices from here is quite limited compared to what you can do from within the Network Monitoring folder located in the Monitoring workspace of the console.
The Network Monitoring folder is available from within the Monitoring workspace as soon as you install OpsMgr (it's a component of one of the management packs we listed earlier in the Requirements and considerations section) and as you can see from Figure 6.11, it contains alert views, state views, performance views, and dashboards to help you manage your devices.

Figure 6.11: Network Monitoring folder
The following steps will show you how easy it is to obtain information about a particular network device that OpsMgr is monitoring:
- Expand the Network Monitoring folder from the Monitoring workspace and click the Network Devices view.
- Select a network device from the central Network Devices state-view pane to get a detailed view of information on the device as shown in Figure 6.12. Notice this device has been discovered as Certified, meaning we have extended monitoring of it when using SNMP.

Figure 6.12: Detailed information and state view
- Now, right-click the device, select Open from the context menu, then click Diagram View and click down a level in the diagram to get a visual of some of the components that are being monitored. Figure 6.13 gives an example of what can be monitored on a certified device managed by SNMP.
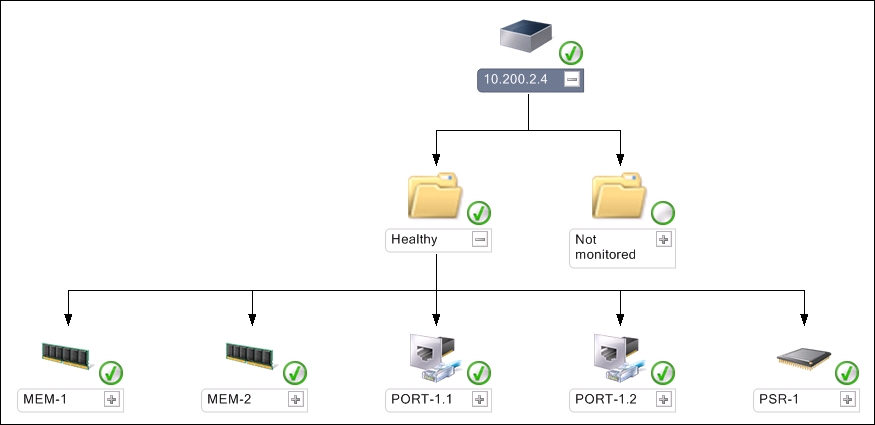
Figure 6.13: Diagram view of a certified network device
- With the top-level network device selected from within the diagram view, click the Performance View option from the tasks pane on the right to pivot to a scoped view of performance counters for that particular device as shown in Figure 6.14.

Figure 6.14: Network device performance view
- Close the performance view to return to the Network Devices state view that you started from.
When you click on a network device from a view within the OpsMgr console, you should notice the Node Tasks menu appear within the Tasks pane on the right as shown in Figure 6.15.
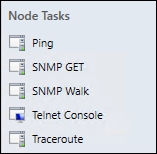
Figure 6.15: Node tasks in the console for network monitoring
These tasks can be very useful when you're looking to pinpoint a connectivity issue or check configuration on your network devices. The following sections will explain what each task does:
This task performs a simple ICMP command (using ping.exe) against a selected network device. It will run the ping from the OpsMgr server that's responsible for managing the network device. Figure 6.16 shows an output window from the Ping task that successfully confirms connectivity to a network device.
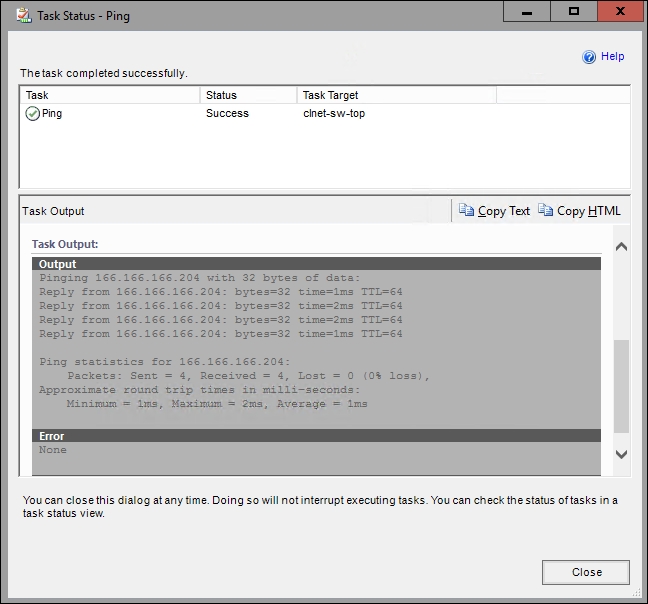
Figure 6.16: Ping task output
This task retrieves a value for the Object Identifier (OID) from the network device using an SNMP GET request.
This task can be used to troubleshoot behavior and verify the configuration of SNMP devices. It uses SNMP GETNEXT requests to retrieve a MIB subtree and output the results to the console and it specifies an OID of .1.3.6.1.2.1 as part of its network monitoring context. In Figure 6.17, you can see the task has run successfully and you can also see that the task has created a file containing the output of the SNMP Walk on the C: drive of the OpsMgr server that manages the network device.

Figure 6.17: The SNMP Walk node task
If you want to view the contents of the output file, just open it using a text editor such as Notepad and you'll see an output similar to Figure 6.18.
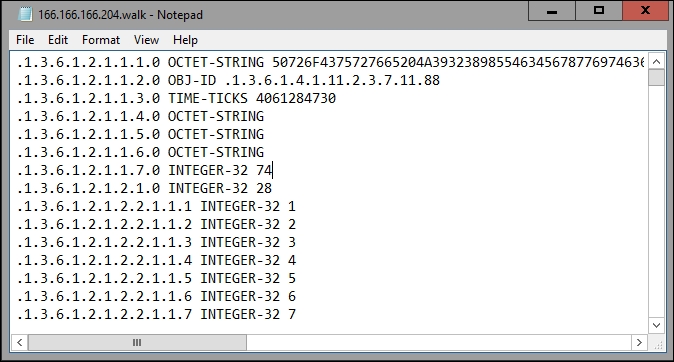
Figure 6.18: SNMP Walk output file
If the Telnet Client feature has been deployed on the computer that is used to launch this task, then a telnet session (using telnet.exe) is initiated. This task can be used as an administration tool to connect to a network device and is dependent on remote telnet administration sessions being enabled on the device.
This task runs an old-school diagnostic tool (tracert.exe) that traces the network route path (hops) and transit times to a particular network device. This can be particularly useful in environments with lots of routers as it can quickly show you how many hops you need to reach a specific IP address. In Figure 6.19 you can see the output from this task indicating that only one hop was necessary to reach our switch.

Figure 6.19: Using the Traceroute task to calculate network paths