
CHAPTER 6
Financial Subworld of Market Value
The world of market value is the value of a business interest in the marketplace. The owner who says her business is worth a certain price is generally referring to this world. These valuations determine possible open market selling prices for a business interest.
Every company has at least three market values at the same time. This is why market value, much like all of business valuation, is a range concept. Each market value level, called a subworld, represents the most likely selling price based on the most likely investor type. The subworlds are asset, financial, and synergy. The asset subworld reflects what the company is worth if the most likely selling price is based on net asset value. That is because the most likely buyer bases the purchase on the company's assets, not on its earnings stream. The financial subworld reflects what an individual or nonstrategic buyer would pay for the business. With either buyer type, the appraisal relies on the company's financial statements as the main source of information. The synergy subworld is the market value of the company when benefits from a possible acquisition are considered.
Market valuation focuses on an owner's wish to derive the highest value obtainable in the marketplace. The financial subworld reflects the market reality that the highest value for many businesses is found by selling to an individual or nonstrategic buyer. Financial intermediaries are the authorities governing the financial subworld, rather than Internal Revenue Service regulations, court precedents, or insurance company rules. Substantial market knowledge is required to determine value in the financial subworld.
Exhibit 6.1 provides the longitude and latitude for this subworld, which enables the reader to view all of the key tenets of the financial subworld.
EXHIBIT 6.1 Longitude and Latitude: Financial Subworld of Market Value

As with other value worlds, the world of market value employs a unique process for determining value, shown in the Exhibit 6.2.
EXHIBIT 6.2 Market Value Process: Select Appraisal Reason

![]() Reasons for Appraisal
Reasons for Appraisal
The reason (also called purpose) for the appraisal selects the appropriate subworld. If the subject is underperforming financially, the asset subworld is in control. If the likely buyer is an individual or nonstrategic company (financial buyer), the financial subworld is in control. Finally, if the buyer is likely to be synergistic with the subject, then the synergy subworld is used.
The next step is to decide if the financial subworld is appropriate. Exhibit 6.3 shows this step within the market valuation process.
EXHIBIT 6.3 Market Value Process: Decide Subworld

![]() Decide Value Subworld
Decide Value Subworld
Exhibit 6.4 lists information that helps determine which subworld should be used for the valuation.
The facts and circumstances of the situation help determine in which subworld to view the subject.
EXHIBIT 6.4 The Financial Market Subworld Is Appropriate if …
|
1. Earnings are used as the basis for the valuation by the acquirer. No synergies are valued in the financial subworld. 2. The company is unlikely to attract a synergistic buyer, because the likely acquirer is either an individual, who brings no synergies to a deal, or a nonstrategic institution. 3. The company's owner-manager will not entertain a synergistic sale since it might result in staff reductions and other expense consolidations. Many owners are paternalistic regarding the people within their organizations and will not sell to a consolidator, even if doing so means receiving a higher selling price. |
EXHIBIT 6.5 Calculate the Benefit Stream

Within the financial subworld, the buyer brings no synergies to the deal. Because of this, the target itself must supply the earnings and the collateral for the transaction finances. This effectively creates a boundary around the valuation in the form of a definable limit as to how much a financial buyer can pay for a business, with the target providing most of this answer.
Once it is determined that the financial subworld is appropriate to use, the next step is to calculate the company's benefit stream. This is shown in Exhibit 6.5.
![]() Calculate Benefit Stream
Calculate Benefit Stream
Each value world employs a different benefit stream (stream) to value a business interest. The benefit stream is defined as:
The earnings, cash flow, and distributions that an authority prescribes is appropriate to employ in a value world. The benefit stream is economic in that it is either derived by recasting financial statements or determined on a pro forma basis.
The authority in each world determines the benefit stream to be used in that world. Streams often vary by industry based on deal-making convention. For instance, throughout the years sellers and buyers of public accounting practices have agreed to use net revenues as the stream whereas many segments of the software industry use subscription revenues as the stream. Some industries use gross margin dollars as the stream. The key here is that the appraiser needs to understand how stream is defined by authorities in the subject industry before a proper market valuation can be completed.
For the purposes of this book, the stream for financial market value is defined as:
Recast earnings before interest, taxes, depreciation and amortization (EBITDA)
Recast EBITDA has been chosen here mainly for descriptive reasons. Once again, no single stream metric is usable across all industries.
EBITDA differs from the operating cash flow in a cash flow statement primarily by excluding payments for taxes or interest as well as changes in working capital. EBITDA also differs from free cash flow because it excludes cash requirements for replacing capital assets (capital expenditures).
Recast EBITDA includes adjustments for one-time expenses and various discretionary expenses of the seller. These earnings are measured before interest since valuation assumes a debt-free basis. Recast EBITDA is also stated on a pretax basis since the market value world typically does not consider the tax status of either party.
Private companies are non-tax-paying flow-through entities, such as S corporations or limited liability companies. Since there are significant differences in individual tax rates, valuators cannot determine tax rates for various parties with certainty. A pretax orientation enables the parties to view the business on a similar basis. Exhibit 6.6 lists some of the numerous recast adjustments.
EXHIBIT 6.6 Recast Earnings Adjustments
Owner related:
Employee related:
One-time expenses:
Discretionary business practices:
Accounting/finance:
|
The process for adjusting, sometimes called normalizing, the income statement is:
- Determine the company's pretax earnings for the appropriate period. Pretax earnings in the most recent period are generally the starting place for this determination. Depending on the circumstances, earnings of several periods may be weighted to best reflect likely earnings in the future. Most buyers are less concerned with financial results from two or three years ago, unless there is a negative trend. Some level of projections is used for the current year. For instance, six months of projections generally can be used to supplement six months of actual results. Weighting is discretionary and sometimes controversial.
- Adjust for owner-related discretionary items. There are a variety of owner-related discretionary items, most of which are adopted to limit taxation. Not all owners’ compensation is recast. Only excess compensation is added back to pretax earnings. This is compensation beyond what the owner is willing to receive postsale or the amount of difference required to hire competent professional management. For example, if an owner who did not plan to continue working after the sale of his business had been receiving $300,000 per year in compensation, and it would cost $200,000 per year to hire two managers to replace him, only $100,000 is added back to pretax earnings.
- Adjust for employee-related items. Certain employee-related items may be changed postsale, and they are added back to pretax earnings. It is important, however, to recast only those items that would not alter the company's morale or prospects postsale.
- Adjust for one-time expenses. As with the other adjustments, one-time expenses must be made judiciously. The items listed in Exhibit 6.6 are not encompassing, since these kinds of adjustments are peculiar to the circumstances of the company.
- Adjust for discretionary business practices. These adjustments are difficult to quantify, because judgment is required as to the business practices of the prospective buyer. The deciding factor should be: Is it reasonable for the business practice to continue beyond the sale?
- Add interest expense and any noncash charges, such as depreciation and amortization. The valuation assumes the company is debt-free at the valuation date, so interest expense is added to pretax earnings. Only interest expense associated with debt that will not survive the transaction should be considered. For instance, if the buyer as part of the transaction will assume a credit line, the interest on this line should not be recast. Noncash charges, such as depreciation and amortization, typically are added back since they reduce earnings but do not affect the cash position of the company.
EXHIBIT 6.7 PrivateCo Recast EBITDA ($000)

Exhibit 6.7 provides an example of how these adjustments are used to recast the income statement of PrivateCo (our example company).
The recast EBITDA is substantially higher than the reported pretax profits. This is not unusual. The key here is to add back only those expenses specific to the current ownership and not be incurred by a new owner.
Exhibit 6.8 shows the weighted recast EBITDA calculation for PrivateCo. The goal is to choose a recast EBITDA that is reasonable and reflects the company's likely earnings capacity in the future. The appraising party chooses how to weight the numbers, if at all. There will probably be a difference of opinion between the seller and buyer here. The seller wants the numbers weighted to show the highest possible value. The buyer, meanwhile, typically uses a scheme that shows the lowest number, even if it means going back into the history of the company. Many market valuations use the trailing 12 months’ recast EBITDA as the basis for the appraisal. This approach often gives more weight to recent years, since they may be more indicative of the future prospects of the company. For presentation purposes, PrivateCo's recast EBITDA is weighted on a 3-2-1 basis, which means the current year's EBITDA has a weight of 3, the previous year has a weight of 2, and the earliest year has a weight of 1.
EXHIBIT 6.8 PrivateCo Weighted Recast EBITDA
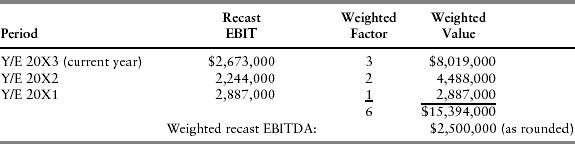
PrivateCo's weighted-average recast EBITDA using a 3-2-1 weighting is $2,500,000. This is achieved by taking the total weighted value of $15.4 million and dividing by the sum of the weighted factors, 6. Thus, for demonstration purposes, the financial subworld stream is $2.5 million.
The next step, shown in Exhibit 6.9, determines the return a prospective investor, or group of buyers, requires when undertaking an acquisition.
EXHIBIT 6.9 Determine Private Return Expectation

![]() Determine Private Return Expectation
Determine Private Return Expectation
Private return expectation (PRE or expectation) converts a benefit stream into a market value. The PRE introduces the concept of market risk and return into the valuation process. As explained in Chapter 3, PREs drive private valuation. The PRE is the quantification of these return expectations in the private capital markets.
The private return expectation is defined as:
The expected rate of return private capital markets require in order to attract funds to a particular investment
Thus, the PRE can be stated as a discount rate, capitalization rate, acquisition multiple, or any other metric that converts the benefit stream to a present value.
There are three different ways to calculate the private return expectation in the financial and synergy subworlds:
1. Specific investor return
2. Specific industry return
3. General return
It should be noted that the private return expectation (i.e., acquisition multiple) is typically the same in the financial and synergy subworlds. This is because the acquisition multiple is an assessment by the buyer of how likely it is that the benefit stream will be realized. Another way of saying this is that a multiple of 5 means that the buyer thinks the current benefit stream will continue for five years. This assessment is usually the same for both subworlds.
SPECIFIC INVESTOR RETURN
The returns required by individual investors differ from corporate investors. At least one study shows that, regardless of interest-rate levels or the general economic environment, individual financial buyers require about 30% returns on their investment. That corresponds to roughly a 3.3 selling multiple.1 Since the corporate investor has already raised capital for its business, return expectations are driven by its capital structure.
If only one corporate prospective buyer is contemplated, the minimum PRE is determined by calculating the weighted average cost of capital for that investor. The actual return expectation depends on the capital's use. A company should not use a company return expectation to evaluate a potential investment if the investment differs from the risk profile. From a valuation/acquisition viewpoint, it generally is not possible to know how a potential acquirer views the risk of achieving expected returns. This means the acquirer's weighted average cost of capital (WACC) must be used to determine the specific investor return.
WACC is an opportunity cost equivalent to a rate of return investors could expect to earn by investing in stock of other companies of comparable risk. WACC is essentially the sum of the weighted cost of debt and the weighted cost of equity. Typically the weighted cost of debt is the after-tax interest rate on loans and bonds. The cost of equity is more difficult to calculate. For public companies, it involves analyzing shareholders’ expected return implicit in the price they have paid to buy or hold their shares. Investors have the choice of buying risk-free Treasury bonds or investing in other, riskier securities. They obviously expect a higher return for higher risk.
Private companies do not have access to the public securities market by which to calculate cost of equity. Chapter 2 introduced the Pepperdine Private Capital Market Line to show the effective cost of private debt and equity capital. Exhibit 2.5 shows private equity returns range from 25% to about 40%. If equity is the only component in the capital structure, equity holders must receive returns of 25% to 40% to compensate them adequately for the risk of ownership.
Purely for presentation purposes, the WACC for PrivateCo is determined in Exhibit 6.10.
EXHIBIT 6.10 PrivateCo Private Cost of Capital Calculation

To calculate a company's WACC, the market value of each capital type is calculated, then weighed based on its proportion of the whole. Market value of debt is typically its face value; PrivateCo's market value of equity of $13.7 million is calculated later in this chapter. If the benefit stream for market value was stated on an after-tax basis, the debt portion of the capital would be tax-effected at the marginal tax rates. Since the stream in this case is stated on a pretax basis (recast EBITDA), the debt is not tax-effected. For presentation purposes, an expected equity return of 25% is used. In this example, PrivateCo has a WACC of 24% (as rounded). This means Joe Mainstreet of PrivateCo creates shareholder value by investing in projects that return more than 24%.
Another way of considering expected investor returns is to calculate the reciprocal of the capitalization rate, which then becomes a selling multiple. For example, a 24% WACC corresponds to an acquisition multiple of approximately 4.2 (1/.24). In general terms, a prospective buyer could pay four times the stream for an acquisition candidate and still meet his or her return expectation. In this case, the buyer bets the benefit stream will continue for a minimum of four years. Increases in the benefit stream beyond four years add to the buyer's overall return.
Due to lack of information, it is difficult to calculate a potential buyer's WACC directly. Typically, WACC can be calculated only for public companies. In situations where more than one buyer is present, or if the single buyer's WACC cannot be determined, the next step is to calculate an industry-specific selling multiple.
SPECIFIC INDUSTRY RETURN
A private guideline acquisition search can be used to determine a private return expectation profile for the likely investor group. This method locates comparable acquisitions and then uses the resulting information to draw a value conclusion. Four steps are used for this method.2
Step 1. Set criteria for collection of acquisition multiples, including time frames. There is latitude here to decide how many years back to consider. Criteria to consider include:
- Line of business. Transactions from companies may be usable if they are similar to the company from an investment perspective. Normally this is determined on an Standard Industrial Code (SIC) code basis.
- Relative asset size and revenues comparable to the company.
- Financial information relative to the company must be available.
- Guideline transactions probably should have occurred in the past five years.
Step 2. Identify the sources from which the data is gathered. A number of databases contain acquisition multiples. The most useful include recast EBITDA multiples. All of the databases named below contain selling multiples helpful in the financial subworld. The key is to develop search criteria that match the valuation requirements. In other words, a company with a $1 million recast EBITDA should be compared against a company of similar size. The most appropriate databases are:
- Institute of Business Appraisers Market Database. The Institute of Business Appraisers (IBA) maintains a database of information on actual sales of private businesses. The database, which contains over 30,000 records of enterprise transactions in over 650 SIC codes, is mainly usable for valuations of less than $2 million. There are 13 points of information per transaction. This database is especially useful for obtaining selling multiples for individual buyers in the financial subworld. Exhibit 6.11 shows data from a typical IBA market comparison.
For discussion purposes, consider SIC code 3469, Metal Stampers. The example shows the results of a search for companies reporting profit. The transaction data does not factor into the decision on whether to use the data, since small financial subworld transactions tend not to be time sensitive (i.e., the earnings multiples paid tend not to vary as much as larger transactions).3
The median price/earnings multiples for these qualifying transactions is 2.4 times. Buyers in these deals are willing to pay, on the average, 2.4 times the annual earnings to close the deal. “Annual earnings” are stated before owner's compensation, interest, and taxes. Unfortunately, it is impossible to determine if annual earnings are equivalent to recast EBITDA as defined earlier in the chapter. - Pratt's Stats®. This database lists approximately 88 different data fields. Most of the transactions reported in Pratt's Stats occur in the $1 million to $30 million range. Exhibit 6.12 represents a search result from Pratt's Stats, once again in SIC Code 3469. Also, companies reporting earnings of more than $500,000 are qualified for consideration.
The Pratt's Stats information is summarized purely for descriptive purposes. In this case, the transactions summary shows a deal price/EBITDA mean multiple of 6.3 times and a deal price/EBITDA median multiple of 5.7 times.
EXHIBIT 6.11 Institute of Business Appraisers: Market Comparison Data

EXHIBIT 6.12 Pratt's Stats Advanced Search Results: Summarized

Step 3. Select the companies that meet the criteria. As with the IBA Market Comparison Data and Pratt's Stats results, companies must meet the valuation criteria. Appraisers do not feel 100% comfortable that the transaction results are totally applicable. Also, any fewer than four to five transactions may not reflect market expectation. It is better to have more than ten transactions, which would reliably reflect the market.
Step 4. Apply the median multiple against the company's benefit stream. The median multiple is better than the mean when applying a selling multiple to the benefit stream. A wide range of multiples within the reported transactions and medians tend to better reflect results.
Let us review the different preliminary values the IBA and Pratt databases yield for PrivateCo. Once again, due to the smaller size of its deals, the IBA database normally is best suited for individual financial subworld valuations, while the Pratt database typically is more appropriate for the nonstrategic financial subworld appraisals. The choice of database is determined by the earnings size of the company. That is because the appraisal should use database results with similar earnings levels. Exhibit 6.13 is an example that shows the ramifications of using different database results to derive a market value.
EXHIBIT 6.13 Comparison of IBA and Pratt Databases
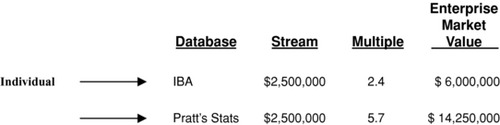
The IBA database is a good source of transactional data for smaller companies with reported earnings of less than $500,000. The Pratt Stats database, however, contains transactions larger than $2 million and can be used to determine values for larger companies. Users of transaction data need to ensure that they apply data consistently from the database to their subject company. For example, the Pratt's Stats benefit stream of recast EBITDA is consistent with how PrivateCo's stream was calculated in Exhibit 6.8; additional adjustments would have to be made to PrivateCo's stream to make the IBA database numbers meaningful.
GENERAL INVESTOR RETURNS
If no industry-specific selling multiples are available or the sample size is not large enough, the next step is to calculate a general investor return. This is accomplished either through the use of databases with general acquisition selling multiples or a general investor return matrix.
General Acquisition Selling Multiples
To determine a general acquisition selling multiple, start with general databases of private acquisition transactions. These databases provide summarized results rather than specific deal transactions. That information is useful when the private guideline industry return method does not yield comparable transactions. Alternatively, it can serve as a supplement to those results.
Exhibit 6.14 displays acquisition multiples over a period of years by transaction size.
EXHIBIT 6.14 GF Data Resources General Acquisition Multiples: Summarized

There are several noteworthy items regarding Exhibit 6.14. First, larger transactions typically realize larger acquisition multiples. This means the market perceives lower risk of achieving the benefit streams of larger transactions and thus places a higher multiple. Second, the range for lower middle market transactions tends to be four to seven times EBITDA. This confirms the segmentation chart shown earlier in the book. Finally, acquisition multiples vary with the amount of senior lending available. For instance, 2009 was a lean year for senior lenders, and the multiples were relatively low as a result.
Exhibit 6.15 shows the final step in the market valuation process.
EXHIBIT 6.15 Derive Value

![]() Derive Value
Derive Value
After the appropriate benefit stream and private return expectations are determined, a final value is derived. The stream is either capitalized or discounted by the private return expectation to create a present value. A review of capitalization versus discounting benefits follows.
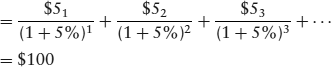
Capitalizing versus Discounting
The end result of capitalizing and discounting a stream is the same: Both convert the stream to a present value. “Present value” is a financial term that describes what something received tomorrow is worth today. To calculate present value, a stream of earnings or cash is discounted, or “reverse compounded.” Doing this requires a discount rate. Thus, $100 received a year from now is worth something less today. This is the present value. Assume money is invested at 5% a year right now with 5% chosen as the discount rate. The present value, then, of $100 promised a year from now using 5% as the discount rate is 95.24% or
![]()
Looking at it another way, $95.24 invested today at 5% interest yields $100 next year.
Consider this contrast between capitalization and discounting.
Capitalization = A method used to convert a single year's stream to a value, such as:
![]()
Using the example given in text:
![]()
In the market value world, another term for “capitalization rate” is the expected investment return of the buyer, expressed as a percentage.
Discounting = A method used to convert the expected future benefit streams to a present value, such as:
![]()
or
When given the same stream, capitalization/discount rate and growth rate and capitalizing and discounting yield the same answer. The two rates are equal when the expected benefits into the future are the same as for the first period. The two rates are different when the benefits vary in the future. For an investment with infinite life, the difference between the discount rate and the capitalization rate is the annually compounded percentage rate of growth or decline in perpetuity in the stream being discounted or capitalized. In other words, in the open market where benefits change in unstable ways in the future, the capitalization rate equals the discount rate minus the annual compounded rate of growth of the stream.
Capitalizing a benefit stream is used for these reasons:
- It is simple to use. With only one calculation, it is easy to perform.
- It is accurate. If the stream is stable or growing at a fairly even rate, the capitalization of stream method determines a value as accurate as the discounted stream method.
- It is accepted. The use of selling multiples (the reciprocal of the capitalization rate) has been employed for many years and has wide acceptance among sellers and buyers.
- It relies on what is known. This method is not based on pie-in-the-sky–type futuristic estimates; rather, it uses historical or current numbers.
Earlier it was determined that PrivateCo's recast EBITDA was $2.5 million and the likely acquisition multiple was 5.7 (from Exhibit 6.12—Pratt's Stats median multiple). Now we can determine the financial market value for PrivateCo:
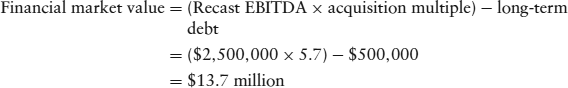
The financial market value of PrivateCo is $13.7 million. Since the long-term debt was deducted from the enterprise value, it is important to note that this figure is a 100% equity value for the company.
Benefit Stream versus Private Return Expectation
Many appraisers and owners focus more on the selling multiple than on adjustments to the earnings. In other words, the parties often focus more on the private return expectation than on the benefit stream. However, investors bring the multiple in the form of their return expectation. Sellers cannot change this fact. What sellers can control is the presentation of the stream.
Professional financial intermediaries attempt to use a selling process to maximize a client's benefit stream. This is vital since the intermediary can influence only the numerator of the value equation. Exhibit 6.16 illustrates this difference.
EXHIBIT 6.16 Control of Benefit Stream versus Expectation

The denominator of the valuation equation is the required rate of return needed by buyers to compensate for the risk of making a particular investment. Once buyers understand the risk of an investment, they bring this expectation to the deal.
TRIANGULATION
Financial intermediaries are the authority in the financial subworld. They “live” in the transfer side of the private capital markets triangle and bring their experience to the valuation process. They enforce the process and provide feedback to the markets. For instance, intermediaries gather and report transactional data that informs participants about acquisition multiples. They also help direct companies into the appropriate value world, including this subworld. This information is then used by the various market players to draw value conclusions. For example, intermediaries have learned that no market exists for the sale of private minority interests because they have tried, in vain, to sell such interests.
| World | PrivateCo Value |
| Asset market value | $2.4 million |
| Collateral value | $2.5 million |
| Insurable value (buy/sell) | $6.5 million |
| Fair market value | $6.8 million |
| Investment value | $7.5 million |
| Impaired goodwill | $13.0 million |
| Financial market value | $13.7 million |
| Owner value | $15.8 million |
| Synergy market value | $16.6 million |
| Public value | $18.2 million |
PrivateCo's value in the financial subworld is $13.7 million, which is almost six times greater than its value in the asset subworld.
Market value is located in the empirical unregulated value quadrant. This means that market transactions are observed within an unregulated marketplace. This is important because profit-motivated players who are free to choose from a host of investment alternatives form the open market. The authority then informs the involved parties as to likely market values based on actual transactions.
Capital availability directly influences market value. Since the likely buyer in the financial subworld is either an individual or a nonstrategic entity, access to capital constrains the valuation. Typically nonstrategic buyers can afford to pay only what they can finance while still receiving a risk-adjusted return. The balance sheet and income stream of the target provide most of the answers regarding financeability. In this subworld without synergies, deals are unlikely to attract growth capital, such as private equity, thereby limiting value.
NOTES
1. Robert Slee, “Different Buyers Pay Different Multiples,” Data Link (May 1997).
2. Shannon P. Pratt, Robert F. Reilly, and Robert R. Schweihs, Valuing a Business: The Analysis and Appraisal of Closely Held Companies, 5th ed. (New York: McGraw-Hill), p. 268.
3. Ray Miles, “In Defense of ‘Stale’ Comparables,” Publication P-299.1 (Plantation, FL: Institute of Business Appraisers, 1992).