
CHAPTER 7
Synergy Subworld of Market Value
A business owner who wants to achieve the highest marketplace value focuses the valuation process on the world of market value. This world focuses on determining the highest and best value for a business. This principle is similar to the “highest and best use of a property” axiom in real estate appraisal.
The synergy subworld reflects the market reality that the highest value for many businesses is found by selling to a strategic buyer. Every company has at least three market values at the same time. This is another example of why market value, much like all business valuation, is a range concept. Each market value step, called a subworld, represents the most likely selling price based on the most likely buyer type. The subworlds are asset, financial, and synergy.
The asset subworld, the subject of Chapter 5, reflects what the company is worth if the most likely selling price is based on net asset value. The asset subworld assumes that the most likely buyer bases the purchase on the company's assets rather than on its earnings stream.
The financial subworld, the subject of Chapter 6, reflects what an individual or nonstrategic buyer might pay for the business.
The synergy subworld reflects the market value of the company when synergies from a possible acquisition are considered. “Synergy” is defined as the increase in performance of the combined firm over what the two firms are already expected to accomplish as independent companies.
Financial intermediaries are the authorities governing the synergy subworld. Determining value in the synergy subworld of market value, more than any other value world, requires substantial market knowledge, especially in terms of the dynamics that shape mergers and acquisitions.
A snapshot of the key tenets of the synergy subworld is provided in Exhibit .
EXHIBIT 7.1 Longitude and Latitude: Synergy Subworld of Market Value

The market value process for the synergy subworld is characterized by the flow chart in Exhibit 7.2.
EXHIBIT 7.2 Market Value Process: Select Appraisal Reason

![]() Reasons for Appraisal
Reasons for Appraisal
The synergy subworld is concerned primarily with strategic or synergistic combinations, such as horizontal and vertical integrations, or any combination where the acquirer can leverage the target's capabilities. Synergies result from a variety of acquisition scenarios. Perhaps the most quantifiable group of synergies emanates from horizontal integrations. A horizontal integrator realizes substantial synergies by cutting duplicate overhead and other expenses. Some of these savings may be shared with the seller. Vertical integrations also create substantial synergies. These tend to be strategic, in that the target helps the acquirer achieve some business goal. Synergies also result from different financial structures of the parties. For instance, the target may realize interest expense savings because of the cheaper borrowing costs of the acquirer.
The next step in the market valuation process, depicted in Exhibit 7.3, considers whether the synergy subworld is appropriate to use in the valuation.
FIGURE 7.3 Market Value Process: Decide Subworld
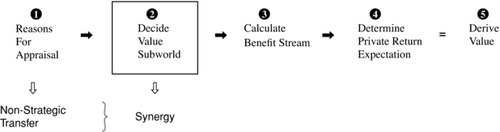
![]() Decide Value Subworld
Decide Value Subworld
The synergy subworld is the market value of the company when synergies from a possible acquisition are considered. As such, this subworld is accessed only when a strategic or synergistic buyer or group of buyers is identified.
The guidelines listed in Exhibit help determine whether a company's highest value is the synergy subworld.
EXHIBIT 7.4 The Synergy Subworld Is Appropriate if …
|
1. The company participates in an industry that is being vertically or horizontally integrated, or it can be determined that a buyer can synergistically leverage the company's capabilities. 2. Synergies can be quantified with some level of certainty prior to a transaction. 3. Some of the following strategic motivations exist between the company and prospective acquirers: a. The company possesses technology or patents difficult or impossible to duplicate. b. The company employs a management team that is considered exceptional. c. The company has a strong market position that enjoys monopolistic attributes. d. The company uses business practices or processes dramatically more efficient than its counterparts. e. The company has developed a unique business model that is transferable to an acquirer. f. The company has access to worldwide markets that enables it to purchase and sell more effectively than the competition. |
If the answer to a number of the statements in Exhibit is yes, then the company should be valued in the synergy subworld. Research on the company's industry should indicate if vertical or horizontal integrations or other strategic/synergistic acquisitions are taking place. The company's management team generally knows if the company is an attractive target to strategic buyers.
Once it is determined the synergy subworld is appropriate to use, the next step is to calculate a benefit stream. Exhibit 7.3 shows this step.
EXHIBIT 7.5 Calculate Benefit Stream

![]() Calculate the Benefit Stream
Calculate the Benefit Stream
If the synergy subworld is the appropriate value level, the next step is to calculate a suitable benefit stream (stream). Each value world employs a different Stream to value a business interest. For these purposes, stream is defined as:
The earnings, cash flow, and distributions that an authority prescribes is appropriate to employ in a value world. The benefit stream is economic in that it is either derived by recasting financial statements or determined on a pro forma basis.
The authority in each world determines the benefit stream to be used in that world. Streams often vary by industry based on deal-making convention. For instance, throughout the years sellers and buyers of public accounting practices have agreed to use net revenues as the stream whereas many segments of the software industry use subscription revenues as the stream. Some industries use gross margin dollars as the stream. The key here is that the appraiser needs to understand how the stream is defined by authorities in the subject industry before a proper market valuation can be completed.
Since the market value world signifies the value available in the marketplace, the stream should reflect the varied possibilities of that market. For demonstration purposes, the benefit stream for synergy subworld stream is:
![]()
Recast earnings before interest, taxes, depreciation, and amortization (EBITDA) is adjusted for one-time expenses and various discretionary expenses of the seller. These earnings are measured before interest since the valuation assumes a debt-free basis. Recast EBITDA is also stated on a pretax basis since the market value world typically does not consider the tax status of either party. This lack of tax consideration is driven by the fact that many private companies are non-tax-paying flow-through entities, such as S corporations and limited liability companies. There are significant differences within the individual tax rates, such that tax rates for other parties cannot be determined with certainty. A pretax basis enables the parties to view the business on a similar basis. The amount of enjoyed synergies represents the synergies that a party can reasonably expect to realize, or receive credit for, in the acquisition. The adjustments to recast EBITDA are numerous. Exhibit lists typical adjustments.
EXHIBIT 7.6 Recast Earnings Adjustments
Owner related:
|
Employee related:
|
One-time expenses:
|
Discretionary business practices:
|
Accounting/finance:
|
SYNERGIES
The synergy subworld stream includes adjusted EBITDA plus the amount of enjoyed synergies by the company. The amounts of enjoyed synergies are the estimated synergies credited to, or kept by, a party in a deal. First the total expected synergies in a deal are forecast. Then an estimate of the enjoyed synergies credited to each party is made. Usually the buyer is responsible for creating synergies. Buyers do not readily give the value of synergies away, since the realization of the synergies happens only while they own the business. A high level of realism and significant experience are necessary when quantifying enjoyed synergies.
The next synergy types, which are synergies with quantifiable certainty, may be available to the parties in a deal.
- Cost savings
- Revenue enhancements
- Gross margin enhancements
- Strategic combinations
Cost Savings
Cost savings are generally the easiest synergies to estimate with certainty. They are sometimes referred to as “hard synergies” since they emanate from hard numbers.1 Examples of cost savings are elimination of jobs, facilities, and related expenses no longer needed due to consolidation. There are three primary types of cost savings grouped by the type of expected acquisition: horizontal integration, vertical integration, and financial structure.
Exhibit lists synergies available in the cost savings category.
EXHIBIT 7.7 Cost Savings Synergies
| Horizontal integration: | A variety of synergies are created with a horizontal integration. This type of acquisition is generally used to increase market share by purchasing a competitor. It is typically the least risky type of merger due to the buyer's familiarity with the industry and the likelihood of reducing operating expenses after the transaction. Examples of synergies are |
|
|
| Vertical integration: | Some synergies are realized from a vertical integration. Vertical integration is used to control production processes or to protect the technical core of the company, such as the material flow, distribution or marketing processes. Examples of synergies are |
|
|
| Financial structure: | The financial structure of the deal may allow for some synergies. |
|
Exhibit shows how cost savings synergies are developed in a valuation. This example assumes that several horizontal integrators are active in PrivateCo's industry segment and should have an interest in acquiring the company. The “Total Synergies” in the exhibit likely exist between PrivateCo and any of the consolidators; whereas, “Total Shared Synergies” shows the appraiser's estimate as to the percentage of the total synergies that is fair or reasonable for PrivateCo to enjoy.
EXHIBIT 7.8 Anticipated Cost Savings Synergies: PrivateCo/Horizontal Integrator
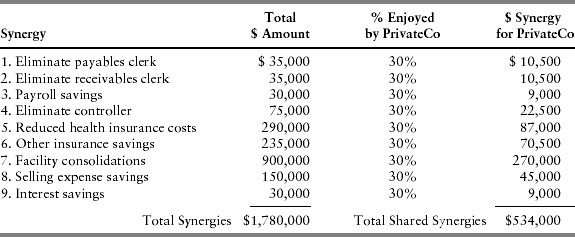
A number of possible synergies may be realized if PrivateCo is acquired by a horizontal integrator. Unfortunately, synergy is often a euphemism for layoffs. Typically, a number of job positions are redundant in an acquisition. There should also be duplicate expenses that result in cost savings when eliminated. The ninth synergy listed, interest savings, results from the lower interest rate that the consolidator is expected to enjoy relative to PrivateCo's rate. This synergy is itemized under the strategic type of acquisition, but it may be employed in the horizontal or vertical integrated acquisition types as appropriate. Once again, a fair amount of work and market knowledge is required to estimate defensible synergies. But knowledgeable people working diligently in a market are able to achieve the highest and best value. These are the high-end outlying values that form the edge of the market. Rather than explaining them away or merely dismissing this value, the synergy subworld is a systematic method to document and achieve value.
EXHIBIT 7.9 Slee's Shared Synergy Guide
| % Shared | Profile |
| 0–10 | Company is in the lowest quartile of its peers, and the certainty of potential synergy realization is low. |
| 10–20 | Company is in the middle of industry norms, and the certainty of potential synergy realization is less than compelling. |
| 20–40 | Company is in the top 10% of its peers, and the certainty of potential synergy is compelling. |
| 50 | Company is the top performer of its peer group, and the certainty of potential synergy realization is high. |
This analysis shows the total synergies generated by PrivateCo and a horizontal integrator is $1,780,000. Under these estimates, PrivateCo would enjoy $534,000 of these synergies. Estimating shared synergies is a difficult task, since very little serious study is focused in this area. Exhibit contains a rough guide for estimating shared synergies. From a seller's perspective, rarely does a buyer share more than 50% of total synergies. This is because buyers believe they are responsible for causing at least half of the realized synergies. Of course, this entire discussion is very seller-oriented. Buyers do not offer to share any synergies unless put under pressure to do so. If the company is a routine financial performer relative to its industry peers, and the synergies are somewhat uncertain, it may only enjoy 10% to 20% or less of the total synergies. Top performers in an industry group, with a high degree of certainty regarding synergy realization, may be able to negotiate sharing 50% of the synergies generated by a deal. Companies can discover how they relate to their peers by reviewing the RMA Statement Studies or by checking with industry trade associations. The argument for synergy sharing must be made on a case-by-case basis.
There is some evidence to support a 50% synergy sharing in a strategic combination, at least in the form of a court case involving minority shareholders of a corporation that was controlled by the acquiring corporation. In the Mills v. Electric AutoLite case, the court decided that the acquisition had created synergistic benefits that must be shared equally between the parties.2 In its opinion, the court discussed various types of synergy and expressed concern that synergistic benefits should be shared among the shareholders.
The benefit stream for PrivateCo on a cost-savings synergy subworld basis is:

The synergy subworld stream for PrivateCo is rounded to $3 million. The recast EBITDA of $2.5 million was established in Chapter 6. The addition of $534,000 in enjoyed synergies may not seem considerable, but it makes a substantial difference when this enjoyed synergy number is capitalized or discounted.
Revenue Enhancements
Occasionally an acquirer and its target can achieve a higher level of sales growth together than either company could on its own. Revenue enhancements are difficult to quantify, but they can dramatically add synergy. The most quantifiable revenue enhancement occurs when the distribution channel of the company or acquirer can be used to increase sales of the other party. For example, if a large government supplier acquires a manufacturer of products that are not currently sold to the government, the acquirer might be able to enhance its revenues. An estimate of revenues generated by this combination is shown next.
Acquirer: $1 billion government supplier of clothing for the army.
Company: $50 million manufacturer of boots and accessories, with no government sales.
Estimate: The acquirer's revenues may increase $25 million by selling the company's products through the government channel (in addition to the $50 million revenue the company currently realizes).
The ultimate calculation for a revenue enhancement synergy involves calculating the profitability of the incremental revenues.
Gross Margin Enhancements
Occasionally business leaders can enhance gross margins by combining companies. This occurs when the buying power of the acquirer is far superior to the company. For instance, if PrivateCo considers an acquisition by a company that purchases a shared raw material 10% cheaper than PrivateCo, some part of this enhancement should be credited to PrivateCo as an enjoyed synergy.
Synergy is the 2 + 2 = 5 effect … such that the combined return on the firm's resources is greater than the sum of its parts
Gross margin enhancements through market pricing power are more difficult to rationalize. These enhancements happen when the acquirer increases market share to the point where sustainable price increases may be possible. Although gross margins are increased, the company cannot enjoy these synergies since the realization of the price increase comes only after the transaction. It may not be sustainable, and it may be realized in stages to test the market.
Strategic Combination Synergy
Sometimes deals are negotiated and valued under the belief that strategic reasons exist for a combination. A preemptive purchase is an example of a strategic acquisition that occurs when the transaction must be accomplished before competitors have an opportunity to move. Strategic synergies are almost always difficult to quantify and therefore are at the bottom of the certainty list. Exhibit contains a number of specific strategic benefits.
EXHIBIT 7.10 Specific Strategic Benefits
Synergistic acquisitions may generate some of the following benefits:
|
Strategic synergy may be present when a company owns patents or other proprietary rights to technology, the acquisition of which would be prohibitively expensive for a competitor. This situation could give an acquirer a plausible reason for the acquisition as it attempts to fill the technology void in its operations or products. This synergy can be determined by measuring the difference between what the company is worth to a nonstrategic acquirer and what a strategic acquirer must pay to possess the missing technology without the acquisition. Say an acquirer needs to spend $20 million to develop a certain technology, and also it identifies a company for sale with the needed technology. In addition to its nontechnology value, the acquired company might receive credit for some part of the $20 million technology cost.
If this $20 million represents a capital expenditure, it can be quantified with some certainty. However, the treatment for this shared synergy is likely to be different. If the technology is primarily capital equipment, a shared value may be determined and built into the purchase price, perhaps by crediting $4 million to $6 million. If the technology is more process oriented and an income stream can be ascribed to it, however, the benefit may be capitalized and shared as discussed earlier.
EXHIBIT 7.11 depicts synergy and its various sources.
EXHIBIT 7.11 Synergy and Its Sources

The next step in market valuation, shown in Exhibit 7.5, is to determine the return a prospective investor or group of buyers requires when undertaking an acquisition.
EXHIBIT 7.12 Determine Private Return Expectation

![]() Determine Private Return Expectation
Determine Private Return Expectation
Next, determine private return expectation (PRE or expectation). The expectation converts a benefit stream into a market value. PRE is defined as:
The expected rate of return that the private capital markets require in order to attract funds to a particular investment
The PRE converts a benefit stream to a present value. The PRE can be stated as a discount rate, capitalization rate, acquisition multiple, or any other metric that converts the benefit stream to a present value. There are three different ways to calculate the PRE in the financial and synergy subworlds. These methods were explained in detail in Chapter 6 and can be summarized in this way:
1. Specific investor return. Returns required by individual investors differ from those of corporate investors. According to at least one study, individual financial buyers tend to require about 30% returns on their investment, which corresponds to roughly a 3.3 selling multiple.3 Since the corporate investor has already raised capital for its business, return expectations are driven by its capital structure. It follows then that the expectation for a specific company is determined by analyzing the buyer's weighted average cost of capital (WACC).
2. Specific industry return. If merger and acquisition activity information is available in the company's industry, it may be possible to find acquisition multiples through a private guideline search. In this method, one locates comparable acquisition information, then uses the information to draw a value conclusion. A number of transactional databases support this method. Several examples are discussed in Chapter 6.
3. General return. If no industry-specific selling multiples are available, or if the sample size is not large enough, the next step is to calculate a general investor return. This is accomplished either through using databases containing general acquisition selling multiples or by using a general investor return matrix. In Chapter 6, GF Data Resources was shown as a source for general acquisition multiples.
The final step in the market valuation process is shown in Exhibit 7.13.
EXHIBIT 7.13 Derive Value

![]() Derive Value
Derive Value
After an appropriate benefit stream and private return expectations are determined, a final value can be derived. In an earlier example, PrivateCo's synergy stream is $3 million. Assuming the industry buyer group employs an acquisition multiple of 5.7, PrivateCo's synergy market value is:

The synergy market value of PrivateCo is $16.6 million. Since the long-term debt was deducted from the enterprise value, it is important to note that this figure is a 100% equity value for the company.
The stream is either capitalized or discounted by the private return expectation to derive a market value. It is useful to review the differences between capitalizing and discounting benefit streams.
CAPITALIZATION OF BENEFIT STREAMS
Capitalizing the benefit stream is a fairly simple calculation:
![]()
Assuming the industry buyer group employs a private return expectation of 17.5% (1 divided by 5.7 selling multiple), PrivateCo's market value is:
Capitalizing a $3 million stream with a 17.5% capitalization rate yields a market value on an enterprise basis of $17.1 million. For purposes of the following presentation, PrivateCo's $500,000 in long-term debt is not deducted from the enterprise value.
DISCOUNTING OF BENEFIT STREAMS
Most small private companies do not use present value analysis to make investment decisions. Larger companies employ sophisticated discounted cash flow techniques. It is common for companies with sales of more than $150 million to use present value methodology when performing acquisition analysis. Since larger companies tend to buy small companies, middle-market managers must understand the discounting process.
An interesting phenomenon, known as value perspective, occurs frequently in the world of market value regarding discounting benefit stream. Value perspective occurs when a seller values her company by capitalizing strategic or synergistic benefit streams and the buyer discounts the stream. Even if both parties use the same capitalization and discount rate, each party may experience distinct streams, causing substantially different market values. Exhibit 7.14 quantifies value perspective for the prospective seller and buyer of PrivateCo.
EXHIBIT 7.14 PrivateCo/Horizontal Integrator Synergies
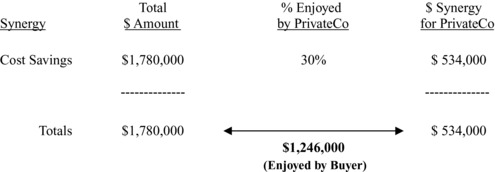
PrivateCo adds $534,000 to its benefit stream by sharing synergies with the hypothetical buyer group. What unshared synergies does the buyer enjoy? According to Exhibit 7.7, the buyer keeps $1,246,000 in synergies not shared with the seller. This has a dramatic valuation impact on the buyer's valuation. Assuming both sides start with recast EBITDA of $2.5 million and both use a 17.5% capitalization/discount rate, the following section shows the math.
SELLER/BUYER MARKET VALUATION
Sellers and buyers naturally view market valuation from opposite sides. These value perspectives can be explained quantitatively, which is extremely helpful during transfer negotiations. The next section discusses the sellers’ value perspective.
Seller Value Perspective
A seller will almost always gravitate to the highest market valuation available, which in the next example is synergy market valuation.
From the seller's perspective, the stream is $3 million, comprised of the recast EBITDA of $2.5 million plus the enjoyed synergies of $534,000. By capitalizing this stream at a 17.5% capitalization rate, the resulting market value is $17.1 million.
Buyer Value Perspective
The expected buyer group experiences the stream from a different perspective than the seller. The buyer believes its stream is about $3.75 million (recast EBITDA of $2.5 million plus shared synergies of $1.25 million). Assuming the expected buyer discounts the stream, instead of capitalizing it, Exhibit 7.15 shows a dramatic difference in valuation.
EXHIBIT 7.15 Buyer Value Perspective

From the potential buyer's perspective, the $3.75 million stream is discounted for five years before a terminal value is calculated. This terminal value represents the present value as if the streams continue into perpetuity.4 Discounting the stream of $3.75 for five years at a 17.5% discount rate yields a present value of $11.8 million. The terminal value has a present value of $9.5 million. Thus, the present value of this stream to the prospective buyer is $21.3 million. The present value of the stream to the buyer is rounded to $4 million more than the capitalized value to the seller. By paying $17 million to the seller, yet receiving $21 million in cash flow from the transaction, the buyer creates $4 million in shareholder value for the buyer's investors.
Another way of calculating this $4 million value difference between the seller's and buyer's perspective is to capitalize the difference in the enjoyed synergies between the parties. The seller and buyer in this scenario enjoy these synergies:
| Buyer-enjoyed synergies | $1,246,000 |
| Seller-enjoyed synergies | 534,000 |
| Difference | $ 712,000 |
| Capitalized | 17.5% |
| Present value | $4,000,000 |
The difference in enjoyed synergies is capitalized at 17.5%. This yields a present value of approximately $4 million. Value perspective is another indication that capitalizing and discounting a stream can yield equivalent answers. In this example, both methods return a $4 million difference in value based on the perspective of the party.
Subworld Comparisons
It is instructive to compare values across market value subworlds. Example market values for PrivateCo are calculated for the asset subworld in Chapter 5 and for the financial subworld in Chapter 6. It is interesting to compare the market values for each subworld, as shown in Exhibit 7.16
EXHIBIT 7.16 Market Values by Subworld

Since the asset subworld is valued using the net asset value method, it does not rely on a benefit stream. For presentation purposes, a selling multiple of 5.7 is applied against the streams of the financial and synergy subworlds. The seller pays off the long-term debt at the closing, which reduces the values of the financial and synergy subworlds. In the example, there is more than a sevenfold difference between the lowest and highest market values. There is more than a $2.5 million difference between the synergy and financial subworlds. From a valuation perspective, this is substantial. It is important to realize that PrivateCo's financials are the same across the various value subworlds. By changing the presentation of the financial numbers, value has been identified, quantified, and recognized. If synergies are conservatively determined, these numbers remain valid during the valuation.
Unique Valuations
Some situations do not fit neatly into the market valuation process. For instance, companies with a heavy real estate component may not generate substantial annual benefit streams. Nevertheless, they have substantial value. A handful of other valuation situations do not fit the market value model. These are:
- Some professional sports teams have negative streams but huge terminal values. It is difficult for appraisers to place almost all of the value on an event that may not occur for ten years, such as the sale of the franchise. Some technology transfers, such as patents, are similarly difficult to appraise using this model. In these situations, appraisers rely on specific comparable transactions to derive value.
- Monopolistic businesses do not necessarily follow these market valuation rules. For instance, if a company produces a one-of-a-kind product with a global market, the private return expectation may not be predictable using standard database searches. If PrivateCo owns a patent for a drug that cures the common cold, the expected selling multiple might be 20 or more to reflect the defensible position of the holder.
- Companies that rely on an earn-out to realize value also require special treatment. An earn-out is a contingent payment structure that pays a seller over time, based on certain events occurring. For example, if a seller has developed a new product that will not be available for sale until next year, a prospective buyer will not simply discount the stream at a large discount rate to derive a present value. Rather, more likely the buyer will structure an earn-out to pay the seller over time.
Brokers and intermediaries often use unique valuations to determine what market process is appropriate for a particular appraisal.
NONENTERPRISE MARKET VALUATIONS
This chapter describes market value in terms of enterprise values, or 100% valuations. Often market value must be derived for less than the enterprise. In most states, more than 50% stock ownership constitutes control. In these cases, the pro rata value of the position is computed using the market value process just defined. For example, if PrivateCo has a market value of $5 million and a 60% position is valued as part of an enterprise sale, the pro rata share is $3 million. If 60% of the stock is market valued as a separate block from the enterprise, it may have a value approaching 100%, or enterprise value. This beyond -- pro rata valuation applies only when the 60% block has no constraints on its ability to control the company through an ownership agreement.
The more difficult market valuation occurs when less than 50% of the stock is valued. As indicated in Chapter 4, minority interests in a private company may have little or no value because there is no marketplace for private minority interests. Unless a contractual agreement is in place between the control and minority shareholders, the minority holders cannot be assured that their shares have value. If the minority interest holder has a contractual distribution stream via an ownership agreement, it is possible to value the position. Basically the expected stream is capitalized with an appropriate risk factor. It must be emphasized that even with a contractual distribution stream, few outside buyers are willing to acquire a minority interest in a private company.
TRIANGULATION
Financial intermediaries are the authority in the synergy subworld. They “live” in the transfer side of the private capital market triangle and bring their experience to the valuation process. They enforce the process and provide feedback to the market. For instance, intermediaries gather and report transactional data that informs participants about acquisition multiples. Intermediaries play a vital role in defining the synergistic benefit stream and guiding companies into this subworld. Then the various market players draw value conclusions. For example, intermediaries have learned that the synergy subworld is the highest level of market value because of the possibility of synergy sharing between seller and buyer in a transfer.
PrivateCo's value in the synergy subworld is $16.6 million. That is six times greater than its value in the asset subworld and more than 20% greater than in the financial subworld. Synergy sharing can dramatically add to a company's value.
| World | PrivateCo Value |
| Asset market value | $2.4 million |
| Collateral value | $2.5 million |
| Insurable value (buy/sell) | $6.7 million |
| Fair market value | $6.8 million |
| Investment value | $7.5 million |
| Impaired goodwill | $13.0 million |
| Financial market value | $13.7 million |
| Owner value | $15.8 million |
| Synergy market value | $16.6 million |
| Public value | $18.2 million |
The synergy subworld is created by financial intermediaries. Buyers do not offer to share synergies with sellers. Nor is it usually obvious which synergies are sharable. An experienced intermediary crafts a deal that treats each party fairly. This means neither side gains totally at the expense of the other.
Instead of fighting over acquisition multiples, the synergy subworld focuses on enhancements to the benefit stream. Owners who want more for their business are encouraged to consider what the buyer brings to the deal. Every dollar of enjoyed synergies increases the market value of a company by a factor of the acquisition multiple.
Market value is located in the empirical unregulated value quadrant. Market transactions are observed within an unregulated marketplace. Profit-motivated players, free to choose from a host of investment alternatives, create this open market.
Capital availability influences market value. By definition, the synergy subworld involves a high level of goodwill in the proposed value. The prospective buyer needs access to equity to close a synergistic transaction. By realizing substantial synergies and having sufficient access to growth capital, buyers can pay the high “synergistic” price yet still substantially add to shareholder value.
NOTES
1. Robert G. Eccles, Kersten L. Lanes, and Thomas C. Wilson, “Are You Paying Too Much for That Acquisition?” Harvard Business Review (July-August 1999): 141. Cost saving and revenue enhancement synergy ideas were taken from this paper.
2. Citation: 434 U.S. 1002; 98 S. Ct. 648; 54 L. Ed. 2d 499; 1977 U.S.
3. Robert Slee, “Different Buyers Pay Different Multiples,” Data Link (May 1997).
4. The terminal value calculation is: Terminal value = present value (5 years, 18% discount)($3.75 million/18%).