
CHAPTER 20
Asset-Based Lending
The asset-based lending industry makes loans secured by a variety of assets. These loans are used for a number of purposes ranging from growth to turnaround financing. Typically, asset-based lenders (ABLs) lend against the current assets of a business, such as the accounts receivable (A/R) and inventory. Other asset classes, such as property, plant, and equipment, may also serve as collateral. It should be noted that commercial banks make asset-based loans as well. But pure ABLs are much more interested in underlying asset values for securing their loans than a commercial bank would be. Conversely, ABLs are less interested in a company's earnings and financial loan covenants than a bank. Another major difference between asset-based lending and commercial banking is that state and federal governments regulate the latter. Since ABLs are not regulated, they have more autonomy to structure deals. Asset-based lending is sometimes called commercial finance or secured lending.
Owner-managers are motivated to seek asset-based lending for a variety of reasons. They may have no choice because their bank requests the migration. Or asset-based lending may be the least expensive source of funds available to their company. Thousands of companies that otherwise would not qualify for traditional bank lending receive asset-based loans each year. Even if the bank says yes, borrowing capacity is often greater with an asset-based loan than with a bank credit line. Also, ABLs can engineer terms that specifically meet a borrower's needs. Since ABLs fully collateralize their positions, they can be more lenient on certain soft items than other secured lenders. Items such as such as personal guarantees and covenants may be negotiable.
HOW ASSET-BASED LENDING WORKS
Normally the ABL loan is a revolving credit facility, known as a revolver. A revolver is a loan that can be drawn down and repaid. The borrower grants a security interest in its receivables, inventory, and/or other assets to the ABL as collateral to secure the loan. A security interest means the lender is granted possession of and ownership in the assets in the event of default. As receivables are paid, the cash is turned over to the lender to pay down the loan balance. When the borrower needs additional working capital, he requests another advance.
The lender manages a revolving credit facility and the related collateral to offer the borrower the largest possible loan amount at any given time. Because the borrower's customers generally are not notified of the assignment of the accounts to the lender, the borrower continues to service its receivables.
ASSET-BASED LENDING
Flow of Activities/Funds
1. The company sells a product or service.
2. The ABL advances funds to the company, based on predetermined advance rates. Applying the advance rates against the eligible assets creates a borrowing base.
3. The company's customers send payments to a lockbox or blocked account controlled by the lender.
4. The ABL credits the company's loan balance for payments received less cost of the loan.
ABLs loan varying amounts against different asset classes. These “advance rates” differ from lender to lender. For a typical borrower, it would not be unusual for an ABL to loan 75% to 85% against eligible receivables and 40% to 60% against eligible raw and finished goods inventory. Lending eligibility rules vary by ABL, but they are stated up front by each lender. Normally there is no advance against work-in-process (WIP) inventory, mainly because in the event of liquidation, the WIP inventory has little or no value to the lender. Advance rates applied against eligible assets compose the borrowing base, or the amount that can be borrowed at a given time. Exhibit 20.1 shows a typical borrowing base certificate. Companies complete this certificate at least monthly and possibly more often, depending on the lender's requirements.
EXHIBIT 20.1 Borrowing Base Certificate

Asset Eligibility
Asset eligibility, which is always described in loan agreements, differs between lenders. “Eligible receivables” usually refers to receivables that the ABL has a perfected first secured interest until collection, arise out of the normal course of the business, and do not exhibit any of these characteristics:
- Receivables 60 days or more past invoice date, typically with a limit of 90 to 120 days from invoice date
- Intracompany or personal receivables
- Foreign source receivables, unless backed by credit insurance or letter of credit
- Receivables subject to any claim or lien other than the primary lender
- Receivables from shipments against a U.S. government contract (unless the borrower can obtain an assignment of claims from the government, which is difficult to do)
- Progress billings
- Contra or short-period accounts
- Customer concentrations, which may cause ineligibility beyond a set amount, say 25% to 30% of A/R to one customer
- Offset relationships, which exist when a company purchases from its customers (Lenders are concerned if these relationships involve large amounts of money because A/R may be offset with payables to the same customer.)
- A receivable more than 50% ineligible for any of the reasons just cited (called a “cross-aged” receivable)
Eligible receivables are generally reduced by all finance charges accrued against receivables.
A variety of factors can cause invoices not to be collected. Some of these factors are bad debt write-offs, warranty returns, fraud, prompt payment discounts, and incorrect invoices. Since ABLs are driven by the actual amount of cash collected, they attempt to quantify the difference between total invoices and cash actually collected. This difference is called dilution, also known as all noncash reductions to A/R. Simply stated, dilution is expressed as a percentage of the total invoices uncollected, as the next example illustrates.
PrivateCo has $5 million in invoices, of which $4.7 million is collected.
- $100,000 is subtracted for prompt payment discounts.
- $100,000 is subtracted for warranty claims.
- $100,000 is subtracted for returned goods.
The diluted amount is $300,000 (amount uncollected); dilution is 6% ($300,000 ÷ $5,000,000).
In this example, the dilution rate is 6%. Dilution is important to ABLs since it is the major factor in setting the advance rate on receivables. No ABL knowingly advances an amount equal to 1 minus the dilution rate. To help determine advance rates against receivables, many ABLs use this formula:
![]()
With a dilution rate of 6%, PrivateCo could expect a maximum A/R advance rate of
![]()
As with most lending sources, ABLs tend to view this situation conservatively, and they may desire a cushion even after accounting for dilution. In this case, PrivateCo could expect an A/R advance rate of 75% to 80% of eligible receivables.
“Eligible inventory” typically means marketable raw or finished goods inventory in which the ABL has a perfected security interest, reduced by the obsolescence reserves of the borrower and excluding
- Inventory that is subject to any lien or assignment other than the ABL
- Inventory that is obsolete, damaged, unsalable, or otherwise unfit for use
- Inventory in transit or located outside the United States
- WIP inventory
- Supplies, packaging, and so on
- Inventory on consignment
- Inventory that is located at third-party premises or out of control of the borrower
- Specialized products that can be sold only to a limited number of purchasers
Many ABLs limit inventory to less than 50% of the total revolver. Most ABLs also limit eligible inventory in a general way, to whatever they say is eligible.
Advance rates for inventory rely less on a formula and more on a number of variables peculiar to the customer asking for the loan. These include the method of tracking inventory (cycle counting versus annual physical inventories or perpetual inventory), the number of inventory turns, the weighting of inventory held between raw and finished goods, and the experience of lenders actually liquidating inventory in that industry. A prospective customer with a reliable cycle counting program and a heavy mix toward high-turning finished goods should be awarded a higher advance rate than a company that does not have those characteristics. Advance rates within industries tend to aggregate around fairly tight numbers, mainly because of liquidation history. Finally, many ABLs will limit the total dollar amount of inventory that can be borrowed against. This “cap” prevents borrowers from adding unnecessary inventory just to increase the amount of the borrowing base.
Other criteria used by ABLs to determine an advance rate against inventory are:
- Age or turns of the inventory
- Price variance of the inventory
- Quality of the inventory
- Ability to return inventory to vendor
As with a receivables advance-rate setting, the ABL considers a variety of factors to determine an appropriate advance rate on inventory.
Asset-based lenders typically make term loans based on fixed assets only in conjunction with a revolving loan against current assets. The borrower needs to supply, at its cost, current fixed-asset appraisals. The ABL normally lends against the estimated liquidated value of the fixed assets less some discount for the effort of selling a distressed asset. Advance rates for fixed assets tend to fall in the 60% to 70% of orderly liquidation value range, or 75% to 80% of forced liquidation value. The fixed-asset loan part of the overall financing is generally less than 30% of the total. Finally, the term for the fixed-asset loan is usually amortized over five years and generally not more than seven years.
LANGUAGE OF ASSET-BASED LENDING
Advance rate. The percentage of funds extended to a client against eligible collateral as stated in a lending contract.
Airball. The portion of an asset-based loan that is not covered by collateral.
Availability. The amount of money a client has available to borrow, determined by the sum of collateral values less all ineligibles multiplied by the agreed advance rate.
Boot collateral. Collateral that is not used to support the transaction, such as intangible assets.
Borrowing base certificate. A form prepared by the borrower that reflects the current status of the collateral. Borrowing base certificates may be due on a daily, weekly, or monthly basis.
Contra. An account created when a company both buys from and sells to the same client and, therefore, has payables and receivables that offset.
Cross aging. When past due receivables exceed a given percentage of a debtor's total A/R, the current portion of receivables is also classified as ineligible.
Dilution. Returns, allowances, credit losses, discounts, and other offsets against A/R. Dilution drives the advance rate in a transaction.
Eligible accounts. Sometimes called “acceptable accounts” or “prime accounts.” These are receivables that satisfy the criteria specified in the security agreement so that they are acceptable to the secured party and included in the borrowing base as eligible collateral and entitle the debtor to an advance.
Grid loan. A secured but not heavily monitored loan. As long as the borrower's company performs according to the loan agreement, collateral monitoring is minimal.
Holdback. The balance of an invoice in excess of the advance. The holdback becomes equity when the invoice is paid.
Jumbo account concentration. A debtor having a balance in excess of 5% of a company's total receivables.
Negative pledge. A promise not to secure certain assets of a company, such as inventory or receivables.
Over advance. A lender's unsecured position that occurs when funds are advanced in excess of contracted terms.
Participation. Occurs when portions of a loan, usually up to 50%, are shared by different lenders.
Progress billing. Billing made on a percentage-of-completion basis and generally found in service, construction, and other industries.
Repurchase period. The period of time, generally 90 to 120 days beyond invoice date, beyond which a sale becomes ineligible for assignment in accordance with contract terms.
Reserve (holdback). The balance of an invoice in excess of the advance. The reserve becomes equity when the invoice is paid.
Retention. The percentage held back by a debtor on a service contract to ensure adequate performance.
Security interest. An interest in, or lien upon, collateral that secures payment or performance of an obligation.
T/A (trade acceptance). A negotiable instrument for the amount of a specific purchase and bearing
ASSET-BASED LENDERS
There are numerous ABLs in the United States, with many specializing in certain industry segments or loan sizes. The hierarchy for deal pricing among ABLs is based on the size of the deal and the perceived riskiness of the borrower. A three-tiered system exists within the ABL industry. These tiers represent broad niches where the various ABL competitors have found some level of success.
ASSET-BASED LENDING TIERS
Tier 1: Funded deals of $15 million or more
Tier 2: Funded deals of $3 to $15 million
Tier 3: Funded deals of less than $3 million
Tier 1 ABLs are those ABLs desiring the least risky credit opportunities. This tier contains most of the larger commercial banks’ ABL divisions. Typically, tier 1 ABLs require borrowers to exhibit a break-even earning capacity, although at times a negative earning capacity expected to turn positive may be acceptable. The earning capacity of a company is the reported pretax profits of the borrower, adjusted for extraordinary items. Tier 1 ABLs also typically want initial fundings of at least $10 million, preferably more than $15 million.
Tier 2 ABLs tend to fund smaller, possibly riskier, borrowers than tier 1 ABLs. As compensation for this additional risk, tier 2 ABL lenders require a higher interest rate than tier 1 lenders. Tier 2 lenders tend to be ABL divisions of midsize banks or independent arms of larger finance companies. Tier 2 ABLs prefer initial fundings of $3 million to $15 million but may bid on larger or smaller deals if the borrower meets its credit box.
Finally, tier 3 ABLs, sometimes called “hard asset lenders,” are driven less by the earning capacity of the borrower and more by liquidation values. It is not unusual for tier 3 lenders to fund companies that have current negative earning capacity and expect to remain so for the foreseeable future. The key for this group is the cash burn rate, which signifies the monthly rate of cash loss in the business. A tier 3 ABL measures the burn rate and determines how long the company can sustain its asset base. Tier 3 lenders have the highest interest rates of the three tiers as well as the most restrictive lending arrangements. For instance, while most tier 1 and 2 lenders lend against 80% of qualifying A/Rs, tier 3 lenders may lend against only 70% to 75%. Tier 3 ABLs may loan as little as $500,000 but normally do not loan more than $2 million to $3 million.
The remainder of this chapter fully describes the three tiers relative to:
1. The credit box for each tier. Credit boxes depict the access variables that a borrower must exhibit to qualify for the loan. Unless borrowers meet certain criteria, they will not be considered for the loan at that tier.
2. A summary of terms likely to be offered by the tier lenders if the borrower meets the lending criteria stated in the credit box. Examples of these terms include advance rates, interest rate, closing fees, monitoring fees, and audit fees.
3. The expected rate of return of the loan, as reflected by the sample terms. The expected rate to the provider considers all of the terms of the deal, such as closing costs, monitoring fees, and various holdbacks. Expected rates are often substantially greater than the stated interest rate.
Exhibit 20.2 provides the capital coordinates for ABL tier 1 lenders.
EXHIBIT 20.2 Capital Coordinates: Asset-Based Lending Tier 1

|
|
| Capital Access Points | ABL Tier 1 |
| Definition | Tier 1 ABLs are those ABLs desiring the least risky credit opportunities. Typically a break-even earning capacity is required, although at times a negative earning capacity expected to turn positive may be acceptable. Tier 1 ABLs typically want initial funding of at least $10 million and preferably more than $15 million. |
| Expected rate of return | 6.2% (based on sample terms) |
| Likely provider | Tier 1 asset-based lenders include the larger commercial banks’ ABL divisions. |
| Value world(s) | Collateral value |
| Transfer method(s) | Available to most transfer methods |
| Appropriate to use when . . . | A borrower with earnings and a stable current asset base has a moderate growth need. Banks have either said no to the loan or cannot provide enough capacity. This can be caused by internal or external growth. |
| Key points to consider | Tier 1 ABLs probably will require audited financial statements from the borrower. Reporting requirements will be heavier than with a bank loan but modest compared to the other tier lenders. |
TIER 1 ASSET-BASED LENDERS
Most large banks have divisions that specialize in making asset-based loans. These tier 1 lenders tend to reflect the conservatism of the parent bank, and they are likely to cater to migrated customers. Migrated customers have been in the commercial or corporate part of the bank, but they are moved into the more strictly monitored asset-based lending group. This generally occurs to borrowers with a good track record but that have exhibited declining, possibly negative, earnings and breaks in other financial ratios. Banks may also migrate borrowers who are exhibiting too much growth. The tier 1 ABL probably monitors the credit each month, as opposed to using quarterly reviews, by using a borrowing base report as well as a review of monthly financial statements.
Exhibit 20.3 depicts the credit box for tier 1 ABLs and sample terms that might be offered to a borrower. Although these terms fluctuate in all tiers due to market conditions and changing motivations of the players, the terms data is taken from a recent Pepperdine survey.1
EXHIBIT 20.3 Tier 1 Asset-Based Lender Credit Box and Sample Terms
| Credit Box | |
| Earning Capacity | Collateral |
| Break-even at funding | Initial funding of at least $10 to $15 million |
| Positive within first year | Somewhat stable collateral base |
| Financial Boundaries (1st quartile) | Covenants |
| No more than 2.5 times debt/EBITDA | Fixed charge of at least 1.0 to 1 |
| Total liabilities to net worth of less than 2.8 to 1 | EBIT to interest expense of at least 1.5 to 1 |
| Sample Terms | |
| Example loan | $10 million facility—$7 million funded |
| 3-year commitment | |
| Interest rate | Prime rate + 2% (Prime = 3.5%) |
| Advance rates | 80%–85% of eligible A/R |
| 50%–60% of eligible inventory | |
| 60%–75% of eligible fixed assets | |
| Closing fee | 1% of facility amount |
| Modification fee | .3% of modified amount |
| Unused line fee | .3% per annum on unused portion |
| Audit fees | $7,500 |
| Prepayment penalty % (year 1, 2) | 2.8%, 1.5% |
The credit box is partitioned into four quadrants: earning capacity, collateral, financial boundaries, and covenants. A prospective borrower must meet each of the specified quadrant requirements to access credit from the tier 1 ABL. The next list presents an explanation of the exhibit.
- Earning capacity. The earning capacity of a company is the reported pretax profits of the borrower, adjusted for extraordinary items. Tier 1 ABLs generally require a borrower to exhibit break-even earnings level at the time of funding, with expectations that the earning capacity will turn positive during the first year after the closing.
- Collateral. Size matters with this lending group. The preferred entry is $15 million in initial funding, but a smaller amount may be considered for companies with a growing collateral base. More than the other tier lenders, tier 1 ABLs want a stable collateral base. For this reason, tier 1 ABLs monitor the collateral less closely than the other tiers, perhaps no more than once a month.
- Financial boundaries. Tier 1 ABLs require the borrower to meet several “boundary” ratios. These boundaries help define the overall riskiness of the lender's portfolio, which ultimately affects its credit box. Many of these boundaries are surveyed in the Pepperdine Private Capital Markets Survey and are presented here. One such boundary might be that no deal is undertaken that has a total debt to EBITDA ratio of more than 2.5 times. “Total debt” means the total interest-bearing debt of the company. “EBITDA” is the earnings before interest, taxes, depreciation, and amortization. ABL lenders use these boundaries to filter out companies that are too highly leveraged. Another boundary ratio is the total liabilities to tangible net worth of not more than 2.8 to 1. “Tangible net worth” is defined as stockholders’ equity less the book value of intangible assets, such as goodwill. Once again, the lender is setting up a financial fence to filter out overly risky transactions.
- Covenants. Nearly all loans have financial covenants that in some way restrict the borrower. These covenants vary greatly from one institution to another and should be negotiated with care. As an example, two covenants are offered in the credit box. The first, fixed charge of at least 1.0 to 1, requires some explanation. The “fixed charge coverage ratio” is defined as the ratio of (1) EBITDA minus capital expenditures not financed by the lender minus taxes to (2) current maturities of long-term debt plus interest expense. This covenant shows whether current earnings on a cash basis are adequate to cover current fixed obligations on a cash basis. Once again, this covenant is tailored to meet the needs of the situation. The second covenant, EBIT (earnings before interest and taxes) to interest expense of at least 1.5 to 1, assures the lender of adequate earnings support for the loan. This covenant is also tailored to the particular borrower. For instance, a company operating at break-even may have a less restrictive covenant for the first year, followed by ever more restrictive covenants in succeeding years.
Exhibit 20.3 illustrates some of the quantitative criteria needed to gain credit access to tier 1 ABLs. Each lender is somewhat unique in its approach to making credit decisions. In other words, its credit box is engineered to meet its return on investment requirements. Of course, various qualitative aspects also factor into the lending decision. Prospective borrowers should interview representatives of the institution about the characteristics of their credit box. Further, borrowers should ask prospective lenders these questions:
- Who has the authority to approve the loan?
- Can we meet that person?
- Will we have access to that decision maker after the loan has closed?
In other words, borrowers should not blindly accept the salesperson's answers to their questions.
The sample terms show a possible deal offering from a tier 1 ABL for a borrower that successfully traverses the credit box. In this example, it is assumed a $10 million facility is sought, with $7 million funded at the closing. It is typical for the facility to begin with excess capacity, mainly so the credit has room to grow. Normally tier 1 ABLs grant a loan term of one to three years, with annual renewability at the option of the lender. The interest rate is normally computed and payable monthly and pegged to some known source, such as that published in the Wall Street Journal. Interest rates generally are described as either the prime rate or LIBOR (London Interbank Offered Rate). In the example, the interest rate is prime plus 2%, with prime assumed at 3.5%. Thus, the example uses 5.5% as the interest rate.
Most tier 1 ABLs charge a closing fee at the time of closing. This fee, sometimes called an origination fee, generally is expressed as an absolute number or a percentage of the facility amount, not the funded amount. The closing fee in the example is $100,000 ($10 million facility amount × 1%). This fee is entirely negotiated and varies from lender to lender. Most ABLs also charge a collateral monitoring fee, which normally is an absolute number paid monthly. An additional cost is the unused line fee, which is some percentage of the difference between the facility amount and the funded amount. In the example, this fee is .3% per annum applied against $3 million ($10 million facility amount – $7 million funded amount), or $9,000 annually, payable monthly. Almost all ABLs charge an audit fee at some stated daily rate. The audits generally are performed quarterly, with a daily rate of $500 to 1,000 per day per person. It should be noted that the borrower must support the audit personnel. It is not unusual for a controller or CFO to spend 30% to 50% of their time supporting these audits.
The expected rate of return to the tier 1 provider based on these sample terms is shown in the next table:
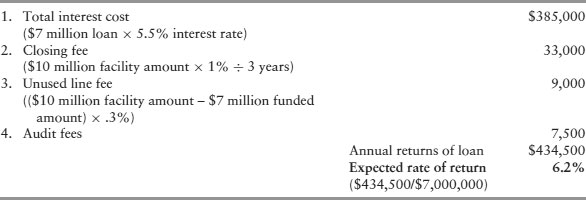
The stated interest rate for the sample terms of 5.5% is increased by the “terms cost” of .7%, which yields an expected rate of return of 6.2%.
EXHIBIT 20.4 Capital Coordinates: Asset-Based Lending Tier 2

|
|
| Capital Access Points | ABL Tier 2 |
| Definition | Tier 2 ABLs tend to fund smaller, and possibly riskier, borrowers than tier 1 ABLs. Tier 2 ABLs prefer initial fundings of $3 to $15 million but may bid on larger or smaller deals if the borrower meets its lending criteria. |
| Expected rate of return | 8.8% (based on sample terms) |
| Likely provider | Tier 2 lenders tend to be ABL divisions of midsize banks, or independent arms of larger financial companies. |
| Value world(s) | Collateral value |
| Transfer method(s) | Available to most transfer methods |
| Appropriate to use when . . . | A midsize borrower does not qualify for bank financing, probably because of an earnings problem; most of these borrowers live off the revolver, which means they run their business off the line and never totally pay it off. |
| Key points to consider | Prospective borrowers should show their deal to tier 1 lenders because they may provide smaller loans than they advertise. Some banks also own tier 2 lenders, under a different name from that of the bank. This is the hardest tier to identify a strong group of lenders because the players are constantly changing their lending criteria. |
TIER 2 ASSET-BASED LENDERS
Tier 2 lenders tend to be ABL divisions of midsize banks or independent arms of larger finance companies. They typically fund deals in the $3 million to $15 million range. Tier 2 ABLs overlap in deal size with both tier 1 and tier 3 lenders. Tier 2 lenders fund riskier borrowers than tier 1 ABLs, in terms of both collateral and financial position of the borrower. As compensation for this additional risk, tier 2 ABL lenders require a higher interest rate. Tier 2 lenders also are more restrictive on eligible assets than tier 1 lenders but may provide higher advance rates on eligible collateral. Tier 2s may also monitor the collateral more strictly than the larger lenders. Exhibit 20.4 displays the capital coordinates for ABL tier 2 lenders
Exhibit 20.5 depicts the credit box and sample terms that might be offered by a tier 2 ABL. The order of importance regarding making a loan for most tier 2 ABLs is quality and amount of collateral, financial wherewithal of the borrower, and the experience and depth of the management team. As long as these characteristics are present, covenants are less important to the tier 2 ABL. For instance, if a borrower is at break-even earnings and collateral is adequate for the loan size, the financial boundaries and covenants may be less restrictive than those shown in the credit box. Tier 2 terms fluctuate depending on market conditions and the changing motivations of the players.2
EXHIBIT 20.5 Tier 2 Asset-Based Lender Credit Box and Sample Terms
| Credit Box | |
| Earning Capacity | Collateral |
| Can be negative at funding | Initial funding of $3 to $15 million |
| Break-even within first year | Heavily monitored collateral base |
| Financial Boundaries (median) | Covenants |
| Likely not more than 3 times debt/EBITDA | Fixed charge of at least 1.1 to 1 by second year |
| Margined collateral is the key | EBIT to interest expense of at least 1.25 to 1 |
| Sample Terms | |
| Example loan | $7 million facility—$4 million funded |
| 3 year commitment | |
| Interest rate | Prime rate + 4% (Prime = 3.5%) |
| Advance rates | 75%–80% of eligible A/R |
| 40%–60% of eligible inventory | |
| 50%–60% of eligible fixed assets | |
| Closing fee | 1.0% of facility amount |
| Unused line fee | .5% per annum on unused portion |
| Audit fees | $12,000 per year |
Once again, the credit box in Exhibit 20.5 is broken into four quadrants: earning capacity, collateral, financial boundaries, and covenants. A prospective borrower must meet each of the specified quadrant requirements to access credit from the tier 2 ABL.
The next list explains the terms.
- Earning capacity. Tier 2 ABLs may fund a company with a negative earning capacity if they expect the capacity will turn to break-even during the first year after the closing. Once again, this characteristic is less important than the collateral position of the borrower.
- Collateral. The preferred entry is $3 million to $5 million in initial funding, but a smaller amount may be considered for companies with growing collateral. Tier 2 ABLs expect to monitor the collateral base intensively. For this reason, Tier 2 ABLs monitor the collateral at least monthly, and perhaps weekly, until the lender is comfortable with the asset base. Sufficient collateral is the most important characteristic of the loan.
- Financial boundaries. Tier 2 ABLs require the borrower to meet several “boundary” ratios. These boundaries help define the overall riskiness of the lender's portfolio. One such boundary might be that deals will not be undertaken with a “total debt to EBITDA” ratio of more than three times. In this case, “total debt” means the total interest-bearing debt of the company. The primary boundary, however, is the margined collateral of the borrower. Margined collateral is calculated by multiplying the eligible assets against the advance rates of the loan agreement. Therefore, a borrower cannot borrow more than its margined collateral.
- Covenants. Most ABL loans have financial covenants that in some way restrict the borrower. These covenants are tailored to the borrower and vary greatly from deal to deal. As an example, two covenants are offered in the credit box. The first covenant, fixed charge of at least 1.1 to 1 by the second year, requires some definition. The fixed charge coverage ratio is the ratio of (1) EBITDA minus capital expenditures not financed by the lender minus taxes to (2) current maturities of long-term debt plus interest expense. This covenant is meant to show that current earnings on a cash basis are adequate to cover current fixed obligations on a cash basis. Many ABLs use a covenant break to trigger demand or acceleration of the note. Once again, this covenant is tailored to meet the needs of the situation. The second, EBIT to interest expense of at least 1.25 to 1, is meant to assure the lender of adequate earnings support for the loan. This covenant is tailored to the particular borrower. For instance, a company operating at break-even may have a less restrictive covenant for the first year, followed by ever more restrictive covenants in succeeding years.
In the example, the interest rate is prime plus 4%, with prime assumed at 3.5%. The example uses a 7.5% interest rate. Some of the other sample terms are different from those presented with the tier 1 example. Typically, tier 2 loans have more restrictive advance rates because these loans generally are made to riskier borrowers than in the tier 1 portfolio. Tier 2 ABLs tighten the reins through more restrictive advance rates and get paid more for taking the risk through a higher interest rate and higher fees.
The next table illustrates the computation of the tier 2 ABL expected rate of return based on the sample terms.
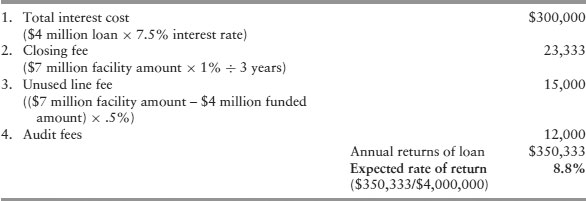
For this example, the stated interest rate of 7.5% is increased by the “terms cost” of 1.3%, which yields an expected rate of return to the tier 2 ABL of 8.8%.
TIER 3 ASSET-BASED LENDERS
Tier 3 ABLs tend to be small, independent lenders. Exhibit 20.6 provides capital coordinates for this lender. Borrowers that fall into this net are going to pay dearly for not being able to attract cheaper capital. Tier 3 ABLs are driven mainly by the liquidated value of the borrower's collateral. It is not unusual for tier 3 lenders to fund companies that have current negative earning capacity and expect to remain so for the foreseeable future. Tier 3 lenders have the highest interest rates of the three tiers as well as the most restrictive lending arrangements. For instance, while most tier 1 and 2 lenders lend against 80% of eligible A/Rs, tier 3 lenders may lend against only 65% to 75%. Tier 3 ABLs may loan as little as $500,000 but normally do not loan more than $2 million to $3 million in total.
EXHIBIT 20.6 Capital Coordinates: Asset-Based Lending Tier 3
|
|
| Capital Access Points | ABL Tier 3 |
| Definition | Tier 3 ABLs are less driven by the earning capacity of the borrower and more concerned with liquidation values. It is not unusual for tier 3 lenders to fund companies that have a current negative earning capacity and expect to remain so for the foreseeable future. Tier 3 ABLs may loan as little as $500,000 but normally do not loan more than $2 to $3 million. |
| Expected rate of return | 17.3% (based on sample terms) |
| Likely provider | Independent, commercial finance companies |
| Value world(s) | Collateral value |
| Transfer method(s) | Available to most transfer methods |
| Appropriate to use when . . . | No other debt alternative exists. Some tier 3 lenders offer deals far more expensive than the expected return shown. |
| Key points to consider | A tier 3 ABL measures the burn rate and determines how long the company can sustain its asset base. Tier 3 lenders usually have the most restrictive advance rates of the three tiers. |
Tier 3 lenders analyze a borrower's cash burn rate to decide if a deal is feasible. If lenders believe the burn rate will not abate, they are unlikely to fund the deal. However, if a tier 3 ABL believes the burn rate will eventually subside, then the collateral is analyzed to determine a safe loan amount.
Exhibit 20.7 depicts the credit box for tier 3 ABLs and sample terms that might be offered. The credit box is partitioned into four quadrants: earning capacity, collateral, financial boundaries, and covenants. A prospective borrower must meet each of the specified quadrant requirements to access credit from the tier 3 ABL. An explanation of these terms is presented next.
- Earning capacity. Tier 3 ABLs are much less concerned with earning capacity than the other tier lenders. The key concern is that negative cash flow caused by negative earnings does not consume the collateral base.
EXHIBIT 20.7 Tier 3 Asset-Based Lender Credit Box and Sample Terms
Credit Box Earning Capacity Collateral Can be negative at funding Initial funding of $500,000 to $3 million Cash burn rate is key Highly monitored collateral base Financial Boundaries Covenants Liquidated collateral is the key Demand loan payment Sample Terms Example loan $2 million facility—$1 million funded Interest rate Prime rate + 9% (Prime = 3.5%) Advance rates 65%–75% of eligible A/R 30%–50% of eligible inventory 30%–40% of eligible fixed assets Closing fee 1.1% of facility amount Collateral monitoring fee $30,000 per year Unused line fee .5% per annum on unused portion Audit fees $6,000 per year - Collateral. Tier 3 ABLs monitor the collateral closely, perhaps even daily, until the borrower is stable enough to be reviewed less often.
- Financial boundaries. These lenders are concerned mainly with liquidated collateral. The combination of liquidated collateral and burn rate drives the tier 3 decision-making process.
- Covenants. Tier 3 lenders have few financial covenants that restrict the borrower. Some lenders have a demand loan payment covenant, which basically entitles the lender to call the loan at its discretion with timely notice. This covenant is intended to protect the lender from further collateral deterioration.
The sample terms describe a possible deal offering from a tier 3 ABL. In this case, assume a $2 million facility is sought with $1 million funded at the closing. It is typical for the facility to begin with excess capacity, mainly so the credit has room to grow. Normally tier 3 ABLs grant a loan term of one to two years, with annual renewability at the option of the lender. In the example, the interest rate is prime plus 9%, with prime assumed at 3.5%. Thus, the example uses 12.5% as the interest rate. To protect their collateral position, tier 3 lenders offer restrictive advance rates. Since liquidation of the collateral is more likely than with the other tiers, these lenders exhibit the highest expenses per dollar loaned. These loans are heavily monitored, often on a daily or weekly basis.
The next table shows the computation of the expected rate of return to the provider based on the sample terms.

For this example, the stated interest rate of 12.5% is increased by the “terms cost” of 4.8%, which yields an expected rate of return to the tier 3 ABL of 17.3%.
NEGOTIATING POINTS
Beyond the terms just stated for each tier, there are other items that must be negotiated. Prospective asset-based borrowers should negotiate the next terms before closing a loan.
Personal Guarantees
Typically all shareholders who own 20% or more of the borrowing company must personally guarantee the ABL loan, although there may be a waiver of this guarantee for large tier 1 loans. In the heat of battle, most borrowers do not think to negotiate releases from the guarantee before the closing. Releases can be achieved through benchmarking the loan. For example, the guarantee can be either partially or fully released when the company reaches a certain profitability level or when the leverage of the company is reduced by a certain amount. Releasing, or burning, a personal guarantee is nearly impossible once a loan closes, because there is no incentive for the lender.
Interest Rate Pricing Matrix
Borrowers can negotiate an interest rate pricing matrix that lessens the interest rate over time as the borrower's financial condition improves. The matrix can tie to any of a variety of financial ratios. Typically only one ratio is chosen, and it corresponds to a problem in the borrower's position at the loan closing. For instance, if the prospective borrower is highly leveraged at the closing, the lender might incentivize the borrower to pay down debt during the loan term by offering the next matrix:
| Pricing Matrix Based on Improving Leverage | ||
| Leverage | Prime Margin | LIBOR Margin |
| 5.0 or higher | 0.50% | 3.00% |
| 4.50 to 4.99 | 0.25% | 2.75% |
| 4.50 or lower | 0.00% | 2.50% |
For this example, “leverage” is defined as the ratio of total liabilities divided by tangible net worth. The lender might offer this pricing matrix if the borrower has a leverage ratio of more than five times at the closing, which corresponds to an interest rate of prime plus .5% or LIBOR plus 3%. The interest rate decreases as leverage decreases, normally measured annually. Instituting a pricing matrix before the closing saves a borrower from having to renegotiate rates later.
Prepayment Charges
For most ABL loans, the loan term ranges from one to three years. If a borrower wishes to terminate the loan agreement before the loan term expires, there may be a sizable prepayment penalty. A frequently quoted prepayment penalty is 3-2-1, meaning there is a 3% charge of the total loan if the borrower cancels the first year, a 2% penalty in the second, and so on. For some tier 2 and tier 3 lenders, this prepayment penalty may be closer to 5%. Borrowers should negotiate these prepayment charges to reasonable levels.
Financial Statements
Many lenders require annual audited financial statements as a condition to closing the loan, especially for loans greater than $5 million. This is a negotiated item and a fairly expensive consideration. Borrowers can agree to provide “reviewed” financial statements in many cases and save themselves more than $10,000 per year.
Loan Closing and Other Fees
The borrower pays the lender's cost of closing the loan. This includes legal, recording, appraisal, and other closing costs. If left unchecked, these fees can be substantial. Closing fees for a $5 million funding can easily exceed $20,000. Borrowers can negotiate caps on these fees such that the lender must receive permission from the borrower to exceed a certain amount. Sometimes the borrower can negotiate a fixed fee for the legal fees part of the closing. The borrower also incurs its own legal fees for reviewing loan documents, in addition to the lender costs.
Further, unused line fees can be negotiated with lenders. Since these fees are opportunity costs, they tend to be viewed by many lenders as something that can be waived.
Covenant Breaks
Most ABLs utilize an acceleration clause that calls the note upon a major covenant violation. Borrowers should review this clause carefully. One negotiating strategy is to limit the major covenants to those that the borrower believes it is unlikely to break. Another strategy is to negotiate a cure period before the acceleration is triggered. For example, upon the covenant violation, the borrower has 60 days to cure the default.
The key to negotiating a deal with an ABL is to consider the terms and conditions of the deal before executing a proposal letter. Many borrowers focus on the interest rate part of the deal to the exclusion of the other terms. As the various examples show, there are many costs associated with these loans, and together they compose the expected return.
Managing a company that uses asset-based lending must be done with foresight. All new initiatives or projects must be viewed relative to the borrowing base capacity and the other rules of asset-based lending. In effect, managers must negotiate and plan the growth of their companies with a view on asset borrowing availability. This may greatly influence the types of customers a company can sell or the types of inventory it buys. A premise of this book is that capital availability and cost of capital directly influence value creation. Judicious use of asset-based lending is yet another example of this connection.
TRIANGULATION
Capitalization is dependent on the value world in which the company is viewed and the availability of transfer methods. Asset-based lending is viewed in the world of collateral value. ABLs use this world to determine the value of the firm from a collateralized lending perspective. To these capital providers, margined collateral of a borrower is what matters most.
Growing businesses that rely on asset-based lending may limit their future growth opportunities. This limitation is algebraically based on the reciprocal of their advance rates. An example will help explain this concept. Suppose ABLCo grants PrivateCo advance rates of 80% of eligible A/Rs and 50% of eligible inventory. If PrivateCo grows quickly, say, more than 25%, the reciprocal of the advance rates, or 20% of A/R and 50% of inventory, may prohibit the company from financing its growth. In other words, unless profits are extremely high, PrivateCo can literally grow itself out of business. This is yet another indication that access to capital affects business value.
Asset-based lending is available to most transfer methods. Borrowers use asset-based lending to fund a transfer when conventional bank financing is not available or does not meet their needs. In these cases, asset-based lending often represents the most effective capital structure alternative. Of course, it matters if one accesses the least expensive lending tier. It costs more than twice as much to borrow from a tier 3 lender than it does to borrow from a tier 1 lender. To accomplish a successful transfer, prospective borrowers must accurately plan the amount of money that can be accessed and the return expectations of the most likely capital provider.
A recent management buyout illustrates the utility of asset-based lending in financing a transfer. The managers were attempting to acquire their division of a larger company; however, due to the lack of equity or equity sponsor, no bank would finance the deal. Fortunately, the division had substantial A/Rs and inventory on its books. The managers arranged an asset-based loan covering the required down payment while the parent issued a subordinated debt note for the remainder of the purchase price. This financing structure facilitates deals unlikely to attract other financing approaches.
NOTES
1. John K. Paglia, Pepperdine Private CapitalMarkets Project Survey Report, April 2010, bschool.pepperdine.edu/privatecapital. Tier 1 data uses first-quartile asset-based lending survey results.
2. Ibid. Tier 2 data uses median asset-based lending survey results.