
CHAPTER 10
Incremental Business Value
The world of incremental business value (IBV) considers the creation, measurement, and management of a company's IBV, that is, a return in excess of the corresponding cost of capital.1 This is a dynamic valuation process based on a company's performance. By understanding how value is determined and influenced, owners are better prepared to increase the value of their business. Like the other value worlds (which business appraisers call “standards of value”), the IBV world follows a certain process for deriving value. However, unlike the other value worlds that rely on static valuation, the IBV world enables owners to value their firms on a constant and continuing basis using a dynamic methodology. This chapter shows how private firms can determine IBV, and how owners can increase that value.
The world of IBV is separate and distinct from all other value worlds. The authority here is the academic community and management consulting industry, which developed most of the IBV conceptual framework. Much of this world is defined by what it is not. Although it uses numbers from financial statements, it jettisons many of the accounting definitions of value. For example, book value does not play a part in determining IBV.
Years ago IBV was known as residual income analysis or, later, return on net assets. In many respects, this world is incommensurable with other value worlds. The primary difference is the IBV world generates and uses an incremental value calculus, as opposed to absolute values derived in the other value worlds. For example, if a company generates a positive IBV of $1 million, this means the company has bettered the shareholder's position by $1 million, not that the company is worth $1 million on an enterprise basis.
Exhibit 10.1 contains the longitude and latitude, or position of key tenets, of this world.
EXHIBIT 10.1 Longitude and Latitude: Incremental Business Value
| Definition | Incremental business value is the result of generating a return in excess of the corresponding cost of capital. |
| Purpose of appraisal | To measure the creation or incremental change to incremental business value in a company, product line, or financial management system. |
| Function of appraisal | For use in creating management bonus plans, project performance, and subsidiary value measurement as well as capital allocation systems and business planning. |
| Quadrant | Notional unregulated. |
| Authority | Management consulting industry. |
| Benefit stream | Recast earnings before interest, taxes, depreciation and amortization (EBITDA). |
| Private return expectation | Discount rate derived by the private cost of capital model. |
| Valuation process summary | IBV = Recast EBITDA – (Investment × Cost of Capital) |
| where: | IBV = incremental business value. |
| Recast EBITDA = earnings before interest, taxes, depreciation, and amortization, recast for owner discretionary expenses and one-time company expenses. | |
| Investment = greater of: (1) the total amount of investment made in a project or business; or (2) the financial market value of the company. | |
| Cost of capital = expected rate of return that capital providers in the private capital markets require in order to fund to a particular investment. | |
| A positive IBV figure means that shareholder value is created. A negative IBV means shareholder value is destroyed. | |
| PrivateCo Example | |
| IBV = Recast EBITDA – (Cost of Capital × Capital Employed) | |
| = $2.8 million – (29% × $13.7 million) | |
| = $(1.1) million (as rounded) |
Although IBV uses language familiar in other worlds, its purpose renders it mutually exclusive to the purposes of other worlds. The purpose of the IBV world is to measure the incremental change to IBV in an entity over time. This is why IBV is a popular tool for use in bonus plans and capital allocation systems. This incremental measurement contrasts sharply with the absolute value measurements afforded in the other value worlds. IBV attempts to grasp the relationship among performance, return on investment, and value. Improving IBV may also improve the value of a business in another world, such as the world of market value, but there is no direct linkage. However, it seems reasonable that if a company improves its net return on assets and adds more IBV, it may also be worth more in the other worlds.
NATURE OF INCREMENTAL BUSINESS VALUE
The prior chapters provide valuation processes that are static in nature. Their final result is stationary and does not indicate whether the owners have created value in their decision making. For example, if the fair market value of PrivateCo is $100 per share, the fair market value process makes no attempt to measure if the return is adequate given the capital employed and the extent to which the company exceeds that minimal value-creating threshold. The world of IBV, however, measures the IBV of a business or project using a dynamic process. Unlike other value worlds, the IBV valuation process enables owners to determine if their investment is likely to create value before actually making the investment. Further, repeated usage of an IBV metric enables owners to monitor value-changing trends over time. The other value worlds do not afford such answers.
IBV is defined as generating revenues beyond the corresponding economic costs. No less a source than Peter Drucker voiced this connection when he said, “Until a business returns a profit that is greater than its cost of capital, it operates at a loss. Never mind that it pays taxes as if it had a genuine profit. The enterprise still returns less to the economy than it devours in resources… . Until then it does not create wealth; it destroys it.”2 Capital has a cost, and this cost can be measured via the private capital access line. If managers do not consider this cost when making investment decisions, they risk destroying IBV. At the least, managers should not invest in projects that are expected to return less than the company's weighted average cost of capital (WACC). More specifically, managers should match the cost of capital with the risk of the potential investment. Therefore, projects that are riskier than the company's risk profile should be evaluated using a higher rate than the WACC.
Some tenets behind IBV can be found in the early 1900s with the concept of residual income. Residual income is defined as operating profit less a capital charge. The idea of residual income first appeared in accounting literature in 1917, and it continued to be discussed well into the 1960s. By the late 1950s and early 1960s, the discussion of IBV was promoted by two economics professors, Miller and Modigliani. These academics viewed value from an economic rather than accounting framework. They showed that IBV is driven by required rates of return in the market to compensate for risk and economic income, which lays the framework for a discounted cash flow methodology. For the first time, managers could use an economic approach to determine the IBV of companies and specific projects. A positive net present value (NPV) adds value, while a negative NPV subtracts value from the ownership. From the 1960s to the 1990s, NPV was the dominant method used to determine IBV. Over the past 10 to 20 years, however, NPV has given way to other frameworks. This transition occurred largely because NPV is derived from future cash flows and therefore is not readily usable for incentive systems based on past performance and current results.
The most recent IBV metrics have focused on easily implemented measures, which can be used for many purposes. Most metrics are created and promoted by management consulting firms. Perhaps the best known is incremental economic value added (EVA) created by Stern Stewart & Co.3 EVA is used to measure wealth changes to the shareholders. Similar to residual income, EVA says that earning a return greater than the cost of capital increases value while earning less than the cost of capital decreases value. Thus, EVA does not rely on accounting measures of investment, such as capitalized expenses for financial reporting purposes, but an economic view that captures and considers period costs such as advertising, ongoing research and development, and so forth as part of the ``economic'' investment.
Traditional accounting methods, such as earnings per share (EPS) or return on investment (ROI), have been used for years for evaluating strategic decisions. Over the last ten years, a key consideration has been that economic—not accounting—concepts drive value. There are several reasons for this.
PROBLEMS WITH USING TRADITIONAL METHODS
Because accounting methods traditionally have been cost oriented, as opposed to value oriented, they do not always align themselves with value creation. They can tell you what is spent and even what you made. But they do not necessarily tell you if you made enough relative to the company's cost of capital. In addition:4
- Accounting measures ignore the time value of capital invested. Each type of capital has a cost, based on the return expectations of the market. The time value of debt is reflected in the rate of interest charged while equity capital also has an opportunity cost. Investors require compensation for investing in the company and not in alternate assets.
- Accounting methods are somewhat subjective, whereas cash is a matter of fact. Managers may be motivated to manipulate accounting figures, whether to increase a bonus or pay less corporate taxes.
- Accounting methods exclude consideration of risk. If a company pronounces earnings of $5 million, it is entirely unclear if this earnings result is commensurate with the risk of owning this earnings stream.
- Traditional measures ignore the investment requirements of the company in calculating earnings. For instance, a company may invest $10 million per year to build a pipeline of products. A service company may require little investment in growing its business each year. Thus, to analyze an investment properly, the cash directed into the business must be considered relative to the returns.
A company is committed to maximizing shareholder returns if it uses value-based approaches. For most private companies, the managers are the shareholders. As the business grows and becomes more sophisticated, it becomes increasingly important to separate the concepts of an owner's personal wealth creation from the task of creating wealth in the business. IBV is an excellent tool in that process.
VALUE-BASED APPROACHES
A number of approaches measure IBV. The NPV method is probably the most frequently used because it has been around longest. However, many competing approaches are introduced in the IBV metric wars, including cash flow return on investment (CFROI), shareholder value added (SVA), cash flow added (CVA), and IBV added (IBVA).5 Each measure offers a somewhat different orientation in the search for IBV. A description of all these metrics is beyond the scope of this chapter. Instead, NPV is compared and contrasted to IBV.
NET PRESENT VALUE
Understanding present value is the starting point to using NPV. Present value is a financial term that describes what something received tomorrow is worth today. To calculate present value, a stream of earnings or cash is discounted or “reverse compounded.” This requires a discount rate. Thus, $100 received a year from now is worth something less today. This is its present value. Assume money is invested at 5% a year right now with 5% chosen as the discount rate. The present value, then, of $100 promised a year from now using 5% as the discount rate is 95.24% or
![]()
Looking at it another way, $95.24 invested today at 5% interest yields $100 next year.
NPV is calculated by adding the initial investment, represented as a negative cash flow, to the present value.
The discount rate is the expected rate of return offered by securities having the same degree of risk as the project. NPV is a key indication of whether a project or investment increases investor value. If NPV is positive, the financial value of the investor's assets should be increased. Thus, the investment is financially attractive. If NPV is zero, the financial value of the investor's assets does not change, producing an indifferent investment. And if NPV is negative, the financial value of the investor's assets should decrease. The investment would not be financially attractive.
Here is another example of how NPV is calculated. Assume a business wants to expand. The plans require $1 million in up-front cash to fund the expansion. For the five years following the expansion, the business will realize a cash flow of $350,000 per year. Beyond the fifth year, the business will realize a cash flow of $200,000 per year for the foreseeable future. Finally, assume the shareholders of the business require a 20% compounded return on their investments. This scenario is represented as shown:

In this example, the shareholders are better off financially by $450,000 if they spend the $1 million and receive $350,000 in cash flow per year for five years and $200,000 per year thereafter. In other words, the shareholders have a NPV on their investment of $450,000.
NPV measures IBV in that it considers economic profits and the time value of money. Owners who invest in projects with a positive NPV create IBV because revenues exceed corresponding economic costs. But, as Appendix A shows, most private owners do not rely on NPV for their investment decisions. For them, IBV might be more beneficial.
There are several pitfalls involving the use of NPV. In short, they are:
- Forecasts of future cash flows tend to be overly optimistic, causing a hockey-stick pattern. This optimism often overvalues the project.
- The terminal value often represents more than 50% of the NPV, which captures value beyond the detailed planning horizon. Terminal value is the value beyond the detailed planning horizon. Terminal value in the prior example is the value from year 6 to the end of the project's useful life. Since the time frame is so far in the future, large terminal values can distort the value of a company or project. As most business owners realize, capturing value beyond five years is extremely difficult.
- NPV is a stock measure and not particularly useful for bonus or incentive programs.
So while NPV is theoretically correct, it may not be the best value-creating approach a private company can use.
INCREMENTAL BUSINESS VALUE
Unlike NPV, which discounts future cash flows to the present, IBV measures whether a company's recast earnings before interest, taxes, depreciation, and amortization (EBITDA) is adequate compensation for the total cost of capital employed. Recast EBITDA is used because it reflects the economic profits available to the shareholder. Further, recast EBITDA is more accessible to private companies and is consistent with the standards required for middle-market businesses. A pretax basis analysis is used because the owner manages the firm's tax position to minimize taxes owed. Pretax analysis is also consistent with the treatment of the benefit streams in the other value worlds. To describe it more clearly, IBV is defined as recast EBITDA less a capital charge, or

Earnings before interest and taxes are adjusted for owner discretionary expenses and other one-time expenses, a recasting that follows the same market-value adjustment process defined in Chapter 6. Major exceptions to the IBV recasting include not adding back discretionary items that are expected to continue in the future. For example, special employee bonuses that are expected to continue for the foreseeable future would not be recast. Cost of capital for IBV purposes is the company's private cost of capital, as determined by the Private Cost of Capital (PCOC) model. The PCOC model determines the market value of both equity capital and interest-bearing debt, then weights each type of capital. For private companies, the cost of equity can be found on the Pepperdine Private Capital Market Line (PPCML). The cost of debt is explicit and does not include a tax shield due to the tax deductibility of interest because the earnings measure, EBITDA, is stated on a pretax basis.
Exhibit 10.2 contains an IBV calculation for PrivateCo. First, recast EBITDA is derived. Since this involves recasting the company's income statement, adjustments are made to show the discretionary expenses of the owner. Taken from a recast performed in Chapter 5, the example shows how these adjustments are used to recast an income statement. PrivateCo has recast EBITDA of $2.8 million (as rounded).
EXHIBIT 10.2 PrivateCo Recast EBITDA ($000)
| Y/E | |
| Item | 20X3 |
| Sales | $22,500 |
| Gross profits | 5,850 |
| SG&A expenses | 3,000 |
| Depreciation | 356 |
| Interest expense | 95 |
| Other | 599 |
| Pretax profits | $1,800 |
| Adjustments | |
| Depreciation | 356 |
| Interest | 95 |
| Excess owner compa | 250 |
| Management feesb | 200 |
| Officer insurancesc | 5.0 |
| Excess accountingd | 6.5 |
| Excess rente | 8.7 |
| Excess health insurance | 8.2 |
| Casualty loss | 35 |
| Donations | 74 |
| Recast EBITDA | $2,800 |
| aThe majority owner is passive; therefore 100% of his compensation will be added back.
bManagement fees are charged each year by another company that the majority owner also controls. cOfficer insurances are added back since the majority shareholder will not be on the payroll after the sale. dSome accounting services are performed mainly for another company the majority owner controls but are billed to PrivateCo. eAssumes current rent will not continue under new ownership. |
|
The next step in calculating IBV is to calculate cost of capital. PrivateCo's private cost of capital is shown in Exhibit 10.3. Every type of capital has a cost. These costs represent the expected returns of the particular capital providers. Several points must be made about the expected rate of return. First, this return is the expected rate of return to the provider. In other words, capital providers require a certain all-in return to compensate them for taking the risk of extending the credit or making the investment. This expected return is different from the effective cost to the borrower or investee. The major difference between the expected return to the provider and effective cost to the borrower are various transaction costs. For example, the borrower may incur legal, brokerage, environmental, and other costs in effecting the transaction.
EXHIBIT 10.3 Pepperdine Private Capital Market Line
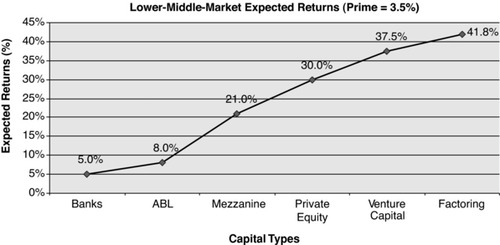
Second, expected returns are used to feed IBV rather than realized returns, even though there are often substantial differences between the two rates. Expected returns are used because capital providers offer credit and structure deals based on what they expect to receive from the investment.
Third, it is now possible to graph expected returns for the major capital types, including banks, asset-based lenders, mezzanine providers, private equity, venture capital and factoring. This graph is called the PPCML, as shown in Exhibit 10.3. The return expectations of the investors who issue private securities are located on or near this line.
Exhibit 10.3 encompasses various capital types in terms of the provider's all-in expected returns. The PPCML is described as median, pretax expected returns of institutional capital providers. For consistency, the capital types chosen to comprise the PPCML reflect likely capital options for mainly lower-middle-market companies (i.e., companies that employ $5 million or more in outside capital).
The PPCML is stated on a pretax basis, both from a provider and from a user perspective. In other words, capital providers offer deals to the marketplace on a pretax basis. For example, if a private equity investor requires a 25% return, this is stated as a pretax return. Also, the PPCML does not assume a tax rate to the investee, even though many of the capital types use interest rates that generate deductible interest expense for the borrower. Capital types are not tax-effected because many owners of private companies manage their company's tax bill through various aggressive techniques. It is virtually impossible to estimate a generalized appropriate tax rate for this market.
PRIVATE COST OF CAPITAL MODEL
It is a premise of this book that public data typically should not be used to derive private discount rates. The argument is framed by answering these five questions:
1. Do privately held firms obtain capital from the public markets? (No)
2. Do the majority of privately held companies go public? (No)
3. Do we have robust sources for obtaining capital in the private capital markets? (Yes)
4. Do these capital sources price risk in their particular segments? (Yes)
5. Is it possible to learn what these return expectations are by segment? (Yes)
This book clearly shows private capital markets are unique yet dynamic; that less than .001% of private companies go public; that risk is priced by capital type or capital access point; and by surveying capital providers, we have learned decision-making behavior. Based on arguments in previous chapters and here, the author believes that public return data should not be used to derive private cost of capital.
A relevant private discount rate model should enable the user to determine the expected rate of return that the market of private capital providers requires in order to attract funds to a particular subject or investment. The PCOC model yields such a discount rate by positioning the user into the decision-making process of private capital providers. The author and John Paglia of Pepperdine University created this model to empower users of private capital market data, such as from the Pepperdine capital market surveys, to derive a discount rate that is generated from empirical data.6
The PCOC model is:
![]()
where: N = number of sources of capital
CAPi = median expected return for capital type i
SCAPi = specific CAP risk adjustment for capital type i
MVi = market value of all outstanding securities i
PCOC depends on private cost of debt (PCOD), private cost of equity (PCOE), and private cost of preferred (PCOP) where applicable.
There are four steps to determining PCOC. PrivateCo's discount rate will now be derived using this process:
1. To determine the appropriate capital types by which to compare, review the credit boxes described in the most current Pepperdine survey. Select the appropriate median CAPe from the survey results.
PrivateCo has a relatively simple capital structure, as shown in Exhibit 10.4. CAPe is found for each capital type from the most recent Pepperdine survey. For existing debt, the analyst can calculate the expected (all-in) return directly from the loan agreement. (See Chapter 17 for guidance on this issue.) For presentation purposes, we will assume that PrivateCo's existing term loan is about to be renegotiated.
By reviewing the PPCML in Exhibit 10.3 and associated data, the CAPe for PrivateCo's term loan and equity is 5% and 30%, respectively. The term loan CAPe is 6%, as opposed to the 5% shown on the PPCML, because the PPCML shows the median return expectation for $5 million loans. PrivateCo's term loan is $500,000, which corresponds to a higher return expectation. The equity CAPe is 30%, the same number as shown for equity on the PPCML, because PrivateCo fits within the “$5MM equity” category of the Pepperdine survey.
2. Determine the market value of each capital type. The next step is to determine the market values of PrivateCo's capital types. Exhibit 10.5 shows these results. In PrivateCo's case, the face value of its debt is also its market value. The market value of PrivateCo's equity is calculated in Chapter 6 at $13.7 million.
3. Apply a specific capital type (SCAP) risk adjustment to the selected median capital type based on a comparison of subject results to the appropriate survey credit box. Use first- and third-quartile returns as a guide to this adjustment.
In order to determine the SCAP risk adjustment, the appraiser must compare surveyed and subject credit boxes for each capital type. Exhibit 10.6 shows this comparison for the term loan.
The surveyed results represent the qualifying minimum threshold for loan approval. For example, in order to make a loan, lenders require a current ratio of 1, fixed charge coverage of 1.2, and so on as a median. Not all credit box characteristics are considered equally important, as the “Very Important” and “Score” columns indicate. For instance, current ratio and debt to worth are less important variables to the lending decision than total debt service ratio and senior debt to EBITDA. The Pepperdine survey asked respondents to score their responses on a 4-point scale. Only fixed charge coverage, senior debt service, and total debt service scored a 3.0 or above. For purposes of deciding PCOD SCAP, greater weight should be put on these variables.
As the last column shows, PrivateCo compares favorably against median results for all metrics. Since PrivateCo generates a high level of EBITDA relative to investment in the business, its leverage ratios are outstanding, as witnessed by a low total debt to EBITDA of .6, which is substantially lower than median survey results. Further, PrivateCo's coverage ratios indicate low debt in the business yet high profitability. PCOD SCAP will reflect that PrivateCo's financial results compare favorably to first-quartile survey responses.
The next step in determining PCOC is to derive PCOE SCAP. This is accomplished by comparing surveyed private equity group expectations to PrivateCo's results. Exhibit 10.7 makes this comparison.
The surveyed results represent Private Equity's credit box (i.e., the criteria that prospects must display in order to qualify for investment). PrivateCo is expected to perform well in revenue and EBITDA growth when compared to median expectations. However, PrivateCo is not expected to surpass third-quartile expectations in these areas.
Private equity groups (PEGs) also scored various investment measures. PrivateCo compares in this way:
EXHIBIT 10.4 PrivateCo CAPe by Capital Type

EXHIBIT 10.5 PrivateCo Market Value by Capital Type
| Capital Type | Book Value | Market Value |
| Term loan | $500,000 | $500,000 |
| Equity | $1,000,000 | $13,700,000 |
EXHIBIT 10.6 Comparison of Surveyed and PrivateCo Term Loan Credit Boxes
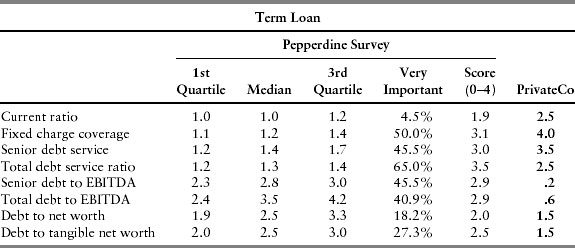
EXHIBIT 10.7 Comparison of Surveyed and PrivateCo Private Equity Credit Boxes

- PEGs are rightly concerned about customer concentrations. PrivateCo has no single customer that represents more than 20% of annual sales. The top 10ten customers represent 40% of annual sales. The top 50 customers represent 70% of sales. This diversity of customers and lack of customer concentration would be viewed as a positive by PEGs.
In summary, PrivateCo qualifies for private equity investment but would likely be viewed as an average performer, with average expectations. For this reason, PCOE SCAP is 0.
The next step is to determine PrivateCo's CAP by capital type, as shown in Exhibit 10.8.
By comparing survey results to PrivateCo actual or expected results, SCAP can be determined for PCOD and PCOE. PrivateCo compares favorably to first-quartile survey term debt results, as shown in Exhibit 10.6. Thus, PCOD SCAP is (.3)%, which is the number needed to convert CAP to the first-quartile survey result of 5.7%. In other words, PrivateCo can expect to pay an all-in PCOD of 5.7%.
Deriving PCOE SCAP requires comparing surveyed results from private equity groups to PrivateCo's actual and expected results. As Exhibit 10.7 shows, PrivateCo would likely be viewed by PEGs as an average candidate. Thus, PCOE SCAP is 0, and PCOE CAP is 30%.
EXHIBIT 10.8 Determination of PrivateCo's CAP by Capital Type

4. Calculate the percentage of capital structure for each CAP. Add the individual percentages to derive PCOC.
If the benefit stream for IBV was stated on an after-tax basis, the debt portion of the capital would be tax-effected at the marginal tax rates. Since the benefit stream in this case is stated on a pretax basis (EBITDA), the debt is not tax-effected. Exhibit 10.9 shows PrivateCo's PCOC calculation.
In this example, PrivateCo has a private cost of capital of 29% (as rounded).
EXHIBIT 10.9 PrivateCo Private Cost of Capital Calculation

RAMIFICATIONS OF USING PCOC
The temptation to use readily available public information to value private companies is strong. Note that within the private capital markets, mainly academics and business appraisers use the guideline public company method. Other parties in the private capital markets—business owners, lenders, investors, estate planners, and so forth—rely on valuation methods that are specifically useful to making decisions in their markets.
Why do parties in the private capital markets not employ public information in their decision-making process? Because these parties have real money in the markets; valuation is not notional to them. Making proper financing and investment decisions requires using theories and methods that are appropriate to the subject's market, such as choosing the correct value world and resulting process when making a valuation decision.
Using a discount rate that is derived from empirically derived private data could alter professional, legalistic, and compliance business appraisal in four ways. First, adjustments such as lack of marketability discounts and control premiums may not be needed. These adjustments originally were created based on the faulty premise that public return expectations could be manipulated to derive private values. Once risk is defined using private return expectations, these public-to-private adjustments are unnecessary.
Second, PCOC provides a risk definition that can be applied across value worlds (standards of value). Each world also has an authority, which is the agent or agents that govern the world. The authority decides whether the intentions of the involved party are acceptable for use in that world and prescribes the methods used in that world. More specifically, “authority” refers to agents or agencies with primary responsibility to develop, adopt, promulgate, and administer standards of practice within that world. Authority decides which purposes are acceptable in its world, sanctions its decisions, develops methodology, and provides a coherent set of rules for participants to follow. Authority derives its influence or legitimacy mainly from government action, compelling logic, and/or the utility of its standards. Authorities from the various value worlds will finally have an empirically derived method of defining risk. It is hoped that these authorities will prescribe use of PCOC in their respective worlds.
Third, business owners finally will have the ability to determine their companies’ cost of capital. This knowledge will help them learn whether they are creating economic value, that is, generating returns on invested capital greater than this cost. This should promote economic value creation as a practical and useful tool. Plus it opens an avenue for business valuators to consult with business owners to help them make better investment and financing decisions.
Finally, the PCOC model will make business appraisal more relevant. Currently, an industry of business appraisers inhabits mainly the notional value worlds. Business owners need more help in competing in a global economy. Tools like the PCOC model will help the appraisal industry become more value added.
The last step to calculate IBV determines the amount of investment made in the business.
INVESTMENT
Investment is the greater of (a) all expenditures in a business (or project) that have a long-term impact or (b) the financial market value of the company. Young companies or those without positive benefit streams are likely to use the first definition; companies with substantial financial market values will use the second definition.
Relative to the first definition, the concept of investment is much more expansive than accounting terms such as book value. For example, investment incorporates spending on “nouns”—people, places, and things.
Examples of investments in people are:
- Forgone salaries of the owners during periods when the business does not generate sufficient cash flow to pay such.
- Training of productive employees.
- Long-term bonuses paid.
Examples of investments in places are:
- Leasehold improvements.
- Buildings owned by the business.
- Other structural improvements.
Examples of investments in things include:
- Subsidized losses from the business.
- Original acquisition cost of fixed assets (underappreciated).
- Expensed infrastructure for the business, such as computer systems.
Once a company generates a large benefit stream, investment equals the equity value of financial market value. This makes sense because IBV measures value created or lost, so financial market value is the correct benchmark. In other words, a company creates additional IBV when it adds to financial market value and loses IBV when it detracts from financial market value.
Joe Mainstreet works with his consultant, Nancy Value, to prepare Exhibit 10.10, which describes the investment in his company.
EXHIBIT 10.10 Investment in PrivateCo
| Item | Y/E 20X3 |
| Original Acquisition Cost of Productive Assets | $3,000,000 |
| + Expensed Portion of Computer System | 100,000 |
| + Training Programs for Existing Employees | 350,000 |
| + Leasehold Improvements | 400,000 |
| + Unpaid Compensation to Joe | 250,000 |
| + Other Expensed Investment | 500,000 |
| Total Investment | $4,600,000 |
Investment in the business includes assets that would appear on the balance sheet as well as expensed items. Further, opportunity costs, such as forgone compensation by the shareholders, are included. These investments all have something in common: Regardless of accounting definitions, they were necessary to build the infrastructure and capabilities of the business.
Total investment in PrivateCo per Exhibit 10.10 is $4.6 million. PrivateCo's financial market value was determined in Chapter 6 as $13.7 million, which is the value that will be used in the next example. Now IBV for PrivateCo can be determined:

The company is generating $(1.1) million in IBV. Once again, this negative IBV number means that Joe is not generating returns that exceed his company's cost of capital. And generating negative IBV ultimately also should lead to a loss of market value.
PROJECT DECISION MAKING
IBV could be used as a basis for management bonus plans, for project performance, and for subsidiary value measurement. For private companies, project investment decisions are an especially noteworthy application because the recast EBITDA of the project can be derived and applied against the cost of capital employed.
Assume Joe Mainstreet wants to hire a salesperson but first wants to understand if this new hire will add value to PrivateCo. Hiring the employee promises to add $75,000 per year in pretax profits. Project investment, or the cost of hiring the employee, is approximately $150,000. This investment includes the salary and fringe benefits of the employee, plus the cost of hiring the employee, plus the indirect labor to support the employee.
Joe uses this formula:

This “employee” project promises to generate an IBV of $31,500. Let us stop here and review what IBV is telling us. It says that by undertaking this investment successfully, Joe will create $31,500 in positive IBV in his business; or, said in a different way, PrivateCo will generate returns on investment of $31,500 greater than its cost of capital.
PROBLEMS WITH INCREMENTAL BUSINESS VALUE
There are several problems associated with the IBV concept:
- IBV is an accounting-based concept. For multiperiod analyses, IBV may have some accounting distortions. For example, historical asset values that distort ROI also distort IBV values.
- There may be distortions caused by inflation. Historical asset values are distorted because inflation affects IBV values.
- The recast to EBITDA must be done correctly to obtain a proper result.
VALUE-CREATION STRATEGIES
In order to create value, owners must understand the variables that drive business value. Exhibit 10.11 contains value drivers tied to actions that owners can implement to increase IBV.7
EXHIBIT 10.11 Actions that Affect Economic Value
| Goals | Value Drivers | Strategies |
| Increase recast EBITDA | Increase sales | Enter niche markets; patent new products to create barriers to entry; launch innovative products; consolidate competitors. |
| Lower cost of goods sold | Develop scale economies; acquire captive access to raw materials; increase efficiencies in processes (production, distribution, services) and labor utilization; implement cutting-edge cost control systems. | |
| Control operating expenses | Budget and monitor expenses; identify fixed versus variable expenses; manage expenses at lowest level possible; keep track of recast items. | |
| Reduce Risk | Reduce business risk | Perform at a higher operating level compared to competitors; establish long-term contracts whenever possible; institute financial transparancy, including the retention of audited financial statements. |
| Reduce cost of capital | Maximize use of debt to support equity, possibly use less costly equity subsitutes, such as mezzanine debt; reduce surprises (volatility of earnings); consistently test the market cost of debt. | |
| Reduce customer concentration | No single customer should account for more than 25% of sales. | |
| Form management structure | Create a functional organization so the owner is not central to the business; develop a strong backup manager. | |
| Employ additional high-yielding capital | Improve investment decisions Decrease capital base | Invest only in positive NPV/EV projects. Implement product line profitability capabilities to determine winners and losers; withdraw or liquidate underperforming businesses. |
INCREASE RECAST EBITDA
Increasing recast EBITDA is of primary importance since this is the metric that most directly affects IBV. Owners can increase sales through internal or external growth or through a combination of the two. In either case, capital is a constraint. Aggressive owners are constantly in search of acquisition opportunities that are accretive and self-financing. This means that consolidation math works in their favor, particularly with a deal structure requiring little or no out-of-pocket cash.
Owners who focus on maximizing their company's gross margins often unlock substantial value. By definition, this means minimizing cost of goods sold. The best investment most owners can make is upgrading the company's purchasing function. Professional materials management pays for itself many times over and helps create value. Companies can benefit greatly from installing cutting-edge inventory management and other throughput management systems.
Finally, most medium-size companies can create IBV by better controlling operating expenses. Unfortunately, many of these companies do not maintain a flexible budget or tie their budgets to longer-term planning. Professional managers, however, are obsessive about budgeting at the lowest possible level in the organization and then creating accountability for everyone involved. Ultimately, in most large companies, employee compensation is tied to success against the budget. This contrasts with many smaller private companies, which do not budget sales and expenses. Of course, always reacting to change is a management method that ensures that small companies remain small.
REDUCE RISK
IBV increases as a company reduces its operating and financial risk. An example of operating risk reduction is the ability to negotiate and implement long-term material purchase and sales contracts. Financial risk is reduced by meticulously decreasing a company's cost of capital.
Another risk-reducing attribute is the elimination of customer concentrations above 25% or so. Concentrations above 25% add risk to a company's financial prospects, which may serve to increase a company's cost of capital. Management concentration causes a similar increase in risk. Some owners are so central to the success of the business that it would take several additional people to replace them. This lack of management institutionalization not only has a negative recasting impact but also adds tremendous risk to an assessment. In either event, concentrations reduce IBV.
EMPLOY HIGH-YIELDING CAPITAL
Private managers should manage risk/return by implementing a disciplined capital allocation system. The payback method, an investment decision approach that considers the length of time it takes to recover the initial cost of a project, without regard to the time value of money, works well for projects that return the investment within a year or so; however, complicated projects require an NPV or IBV approach. Owning a company gets progressively easier and more profitable when assets are deployed correctly.
The single most glaring weakness for most medium-size companies is the lack of vision regarding product and service line profitability. Simply put, many companies do not know where they make money. Outsiders correctly view this lack of control as risky. Once again, companies that budget effectively typically do not have this problem. Proper financial controls enable companies to employ capital more effectively. A lack of these controls causes increased risk relative to the company's ability to achieve its financial goals. Increased risk translates to a lower valuation.
The key to creating value within the value worlds concept is to maximize the variables that determine value in a particular value world. These variables are determined by the authorities in a world. Thus, understanding the purpose for value creation is the proper starting point for the value discussion.
INCREMENTAL BUSINESS VALUE VERSUS MARKET VALUE
Exhibit 10.11 shows a variety of things owners can do to affect the IBV of their company. The question: Will the market value of a private company increase if it consistently invests in positive NPV and IBV projects? The answer: It should.
First, it is helpful to know if the market value of public companies expands with increases in IBV. In his classic book, The Quest for Value,8 Stewart studies the IBV–market value relationship for 618 U.S. public companies. He states that positive EVA (the public company cousin of IBV) and market value correspond well with each other.9
In 1996, Lehn and Makhija studied 241 U.S. public companies and the correlation between EVA and market value. The researchers found a positive correlation higher than the correlation between traditional measures like return on assets (ROA), return on equity (ROE), and return on sales (ROS).10
Finally, in 1996 several researchers from Stern Stewart & Co. presented findings on the relationship between IBVA and market value for 100 bank-holding companies. They calculated regressions to five performance measures including earnings per share (EPS), net income, ROE, ROA, and EVA. The correlations between these performance measures and market value are: EVA, 40%; ROA, 13%; ROE, 10%; net income, 8%; and EPS, 6%. They used data from the ten-year period 1986 through 1995.11
But over the past 15 years academic research has not unilaterally established EVA's correlation to market value and stock returns. The evidence is mixed and has not resolved the debate over performance measures. The empirical results of one study, for instance, do not support the claims that EVA is a better financial tool than traditional accounting measurements in explaining market value. EVA did not significantly outperform traditional accounting measures in tests of relative information content.12
Should private companies expect to experience a positive financial impact with increases in their IBV? There are some direct ties from economic to market value. If a company increases its recast EBITDA substantially, market value should increase. Also, if a company reduces its long-term debt while still maintaining its benefit stream, the market value of shareholder equity is increased. Even if the owner never sells her business, an increase in IBV makes the company stronger and more profitable.
The correlation between IBV and market value for the private company is less than perfect, however. Both the company's industry segment and its desirability to competitors have a dramatic impact on its market value. For instance, if a company participates in an industry segment that does not pay operating goodwill for acquisitions, such as construction companies or machine shops, the company's management may create substantial IBV without a corresponding increase in market value. Yet IBV may understate market value. The synergy subworld of market value relies on increases in value relative to synergistic buyer types. This creation of synergies extends beyond the reach of IBV as measured by IBV. In such cases, IBV serves little purpose as it is designed to be an internal valuation metric. This does not mean that IBV has no market value use. Owner-managers find determining IBV useful because it is a before-the-act tool. This alone separates it from the other value worlds. While more work is needed to correlate a private company's market value with IBV, adopting an IBV framework for financial decision making is clearly beneficial to a private owner–managed company.
TRIANGULATION
IBV is an internal measure of value. Internal metrics are emerging techniques because they are dynamic, rather than static, value methods. In other words, managers can actively plan their activities based on a dynamic approach, as opposed to finding out what the value of the company was six months ago.
Incremental business value is a notional world. It is a value world whose validity is derived from the strength of its coherence to the logical structure established by an authority. As opposed to an empirical world, like market value, which is observed through market experience, or a regulated world, like fair market value, which gives the authority almost total control over value rules, notional worlds exist because an authority says so. The authority must prove its utility to potential participants. The academic community and management consulting industry are the authorities in the IBV world and constantly battle for the attention of their constituents.
Much like the other value worlds, access to capital affects incremental business value. A higher cost of capital increases a company's capital cost employed, which reduces IBV. Likewise, lowering cost of capital while maintaining the same benefit stream increases IBV. The most important connection between IBV and capital, however, is that productivity measures are applied to capital as rigorously as operating assets.
The effect of IBV on business transfer requires more study. Selling a premium business is often difficult because price expectations are so high by the shareholders. Also, an acquirer has to believe it can add value to a targeted business. Many buyers cannot justify paying a high price for a superior business because it is more likely that the target's financial performance will decrease rather than increase after the closing.
Companies that generate positive IBV should realize higher values in most of the value worlds. Like much of the IBV world, however, this area requires further study.
NOTES
1. Rob Slee, “Using the Incremental Business Value Model,” Valuation Strategies (September 2010), pp. 20–25.
2. Peter Drucker, “Peter Drucker Takes the Long View,” Fortune (September 1998).
3. IBVA is a registered trademark of Stern Stewart & Co.
4. David Neidell, “Shareholder Value as a Basis for Strategy,” Foresights Business Studies Journal, Trinity College (2002).
5. The following metrics are registered trademarks: CFROI is a registered trademark of Boston Consulting Group and HOLT Value Associates. SVA is a registered trademark of LEK/Alcar Consulting Group. CVA is a registered trademark of Anelda AB.
6. Rob Slee and John Paglia, “Private Cost of Capital Model,” Value Examiner (March 2010).
7. AICPA, Measuring and Managing Shareholder Value Creation, course offering.
8. G. Bennett Stewart, The Quest for Value (New York: HarperBusiness, 1991).
9. Esa Makelainen, “Economic Value Added as a Management Tool” (Helsinki School of Economics and Business Administration, 1998), p. 16.
10. Ibid.
11. Ibid.
12. Woo Gon Kim, “EVA and Traditional Accounting Measures: Which Metric Is a Better Predictor of Market Value of Hospitality Companies?” Journal of Tourism and Hospitality Research (2006): 30.