
CHAPTER 16
Capital Structure: Introduction
The term “capital structure” refers to the mix of debt and equity financing in a business. Private debt and equity are raised in the private capital markets. Because these markets are quite different from their public counterparts, comparison and analysis is fraught with uncertainty. Investment bankers for large public companies access the public capital markets somewhat predictably. This enables financial managers of public companies to plan their capital structure. Private companies, however, must create capital structure solutions one deal at a time. This difference is monumental. The public capital markets structure helps public companies plan and execute capital solutions with certainty. The private capital markets have much less structure and, even with expert guidance, may not yield any capital.
Yet there is a structure of capital alternatives in the private capital markets. Unlike the organized structure of public capital markets, private markets are more ad hoc. Private markets are more like an outdoor bazaar while public markets resemble a supermarket. Nearly all capital alternatives are available in the private bazaar, but they are found in separate shops or discrete increments. To make financing in private markets even more difficult, capital providers in the bazaar constantly move around and may or may not rely on prior transactions to make current decisions. Fortunately, for those in need of private capital, some organization in this bizarre bazaar is discernible. To understand private markets, we first review public capital markets, then compare and contrast the two markets.
PUBLIC CAPITAL MARKETS
Public capital markets are fairly efficient. Since security pricing and risk/return are more nearly in alignment, access to capital is predictable. By either of these measures, public markets are relatively efficient. Typically, pricing differences between public capital alternatives are measured in basis points (a basis point is .01%) rather than percentage points. The public capital market line, shown in Exhibit 16.1, depicts the expected investor rates of return relative to U.S. public securities.
EXHIBIT 16.1 Public Capital Market Line
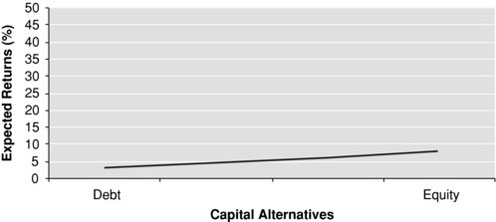
The public capital market line is determined by the capital asset pricing model (CAPM).1 As expected, the riskier the capital type, the higher the return expectation. For example, as of this writing, public equity holders require returns of 8% or so, but debt holders require less than a 4% return. The line is viewed as the expected returns on portfolios of investments, as opposed to returns on single securities. A multitude of capital portfolios comprise the public capital market line.
The rates of return required by private investors also can be graphed through the Pepperdine Private Capital Market Line (PPCML). This line is created empirically since it must be observed in the marketplace. No widely accepted predictive private capital model, such as the CAPM, is used to determine the risk/return equilibrium of private portfolios of securities. The details of the PPCML are described later in this chapter. Exhibit 16.2 shows the summarized line as graphed against the public capital market line.
EXHIBIT 16.2 Public Capital Market Line versus Pepperdine Private Capital Market Line
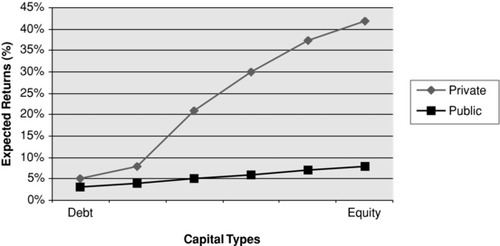
There are three noteworthy things about this chart.
1. The PPCML is quite steep compared to the public capital market line. Private investors perceive substantially more risk in private capital markets and require commensurate returns.
2. If public and private markets enjoyed the same level of efficiency, the two lines would run parallel to each other separated only by liquidity differences.
3. Both lines represent portfolios of expected returns that group around a point on the line. Individual investors’ experience in either market might not fit on a line. Rather, their experience may fit within a larger portfolio of expected returns averaged to a reference point.
Pricing Differences
There are built-in differences between public and private investor return expectations. The early chapters of this book identify and quantify many of these disparities. They largely break into two groups: the cost of being a public entity and the additional return requirement from private equity ownership due to lack of marketability.
The cost of obtaining access to an established trading market is substantial. The flotation cost, which is the cost of selling stock for a public offering, represents the initial cost of gaining access to cheaper public capital. These flotation costs can amount to 10% to 15% of the offering when all underwriting expenses are considered.
John Emory began comprehensive studies of the relationship between a company's initial public offering (IPOs) and the price its shares traded immediately prior to the IPO, for the purpose of analyzing marketability differences between public and private securities.2 Emory examined 593 IPOs and all private transactions occurring within five months prior to those offerings between January 1, 1980, and December 30, 2000. None of the 593 companies were development-stage companies. In fact, all were financially sound before the offering. The private sales and transactions took place at a 47% average discount from the price at which the stock subsequently came to market. The range of marketability discounts was from 3% to 94%, with a median of 48%.
The combination of flotation costs and lack of marketability differences indicate a built-in pricing difference of more than 50% between public and private capital markets.
Efficiency Differences
Compared to public markets, private capital markets are inefficient. They are hampered by information opacity, manager orientation and risk?, and motives of managers and owners.
Information Opacity
Inefficiency in private capital markets is caused by information opacity. Private shareholders, as a group, do not provide outside parties with adequate information about their company's financial outlook, current operations, or future prospects. This lack of information prohibits capital providers from creating an efficient market. For example, most private businesses do not obtain audited financial statements. Further, owner-managers have a larger incentive to merge their personal life with the business in order to reduce taxes. They have very little incentive to provide financial transparency. Often it is not entirely clear who owns the collateral pool, the business or the owner. Outside capital providers strongly prefer to finance businesses with assets separate from the owner.
Manager Orientation and Risk
Owner management results in implied unsystematic risks. Unsystematic risks are company specific and attributable to management. These risks are in addition to systematic risks affecting the overall corporate environment. Unsystematic risk also exists in public companies but to a lesser extent. For example, a private company is more likely to rely on the skill of one or two individuals for profitability. Their skills probably are not easily transferable. Most small private companies do not employ a chief financial officer; rather they have either a controller or bookkeeper that closes the books. Yet this “money-saving” decision often costs the company because it leads to inadequate financial management. Private companies also frequently rely on outside vendors to provide critical services and skills. Since unsystematic risks typically are high for private companies, capital providers perceive greater risk.
Manager and Owner Motives
Public managers and private owners often have different motivations for capitalizing a business. Exhibit 16.3 compares a few of the capital motives. Understanding the individual motives further explains efficiency differences in the markets.
EXHIBIT 16.3 Comparison of Capital Motives
| Public Managers Want | Private Owners Want |
| As many shareholders as possible | As few shareholders as possible |
| To build equity in the business | To minimize equity in the business |
| To optimize the firm's capital structure | To stretch their equity as far as possible |
| To borrow at the firm's marginal cost of capital | To borrow without personal guarantees |
| To manage “net assets” on the balance sheet | To manage the business, not the balance sheet |
Public managers are motivated to increase the number of shareholders in the company and build equity. A small number of shareholders is risky to the public manager because a group may usurp control of the company. Private owners want to control the company. They do not want to share equity. In many cases, this limits the private company's growth because debt providers will not form the total capitalization of the company.
Further, public managers are encouraged by Wall Street to maximize earnings, thereby building the equity base. Private owners are motivated to reduce reported earnings in order to reduce taxes, which dilutes equity. Moreover, private companies employ pass-through entities, such as limited liability companies and S corporations, to distribute money out of the company, reducing equity further.
Public company managers seek to borrow at their firm's marginal cost of capital by receiving investment at the next least expensive capital point available. Ultimately public managers wish to optimize their company's capital structure by always employing the least expensive cost of capital. Private owners are motivated more by the desire to avoid providing personal guarantees and less by the incremental cost of capital. Many private owners would gladly pay hundreds of basis points in extra interest if it means they are relieved from the responsibility of personally guaranteeing a loan.
Public managers are strongly motivated to manage the net assets of the business because most public companies have bonus systems tied to return on net assets. The more effectively a public manager controls the net assets, the bigger his bonus. But private owners are compensated out of cash flow, not on a balance sheet metric. They are motivated to manage the business, not the balance sheet.
Authority
The concept of authority is central to this book's premise that rules and processes observed in the private capital markets are not randomly set. Authorities develop and promulgate standards of practice. Then the constituents follow within the authority's sphere of influence. Nowhere is this power more obvious than in capital structure formation. Capital providers are authorities that possess strong sanctioning ability: They do not have to fund the capital need.
Utility is the strongest source of an authority's legitimacy. This is because there is no reason for prospective borrowers or investees to be concerned with a capital authority unless they need capital. A capital authority's boundary is established by its marginal utility. In other words, personal guarantees notwithstanding, borrowers typically will seek the cheapest capital alternative while capital authorities or sources offer funding only on tightly defined terms. This concept of marginal utility explains why factoring is a funding option of last resort because it typically is the most expensive form of capital.
Capital authorities promulgate their credit requirements through the use of credit boxes. Credit boxes depict the criteria necessary to access the specific capital. Borrowers that do not qualify for credit at one capital access point must continue to move up the PPCML until they can access an authority's capital. From the authority's perspective, a credit box effectively creates a boundary around its return expectation.
A New Private Line Developing?
Reducing these inefficiencies ultimately should flatten the PPCML. In fact, Exhibit 16.4 shows several PPCMLs based on size of loan/investment.3 Larger loan/investments typically require lower return expectations. Further institutionalization of the lower middle market should help flatten the private capital market line over time.
EXHIBIT 16.4 Pepperdine Private Capital Market Lines by Loan/Investment Size

Since private equity groups and other institutional investors entered the market in the 1990s, financial transparency is more common in the lower-middle market. They have implemented financial control systems and disciplined reporting. They also bring sophisticated management techniques to companies, which benefit from the attention in three ways.
1. Increased financial transparency enables the company to create layered capital structures that support aggressive growth plans.
2. Unsystematic risks are reduced, primarily through the implementation of functional management organizations. This approach lessens reliance on one or two key managers.
3. Outside investor's capital motives are more aligned with public managers.
Because of these reasons, company value creation and deployment of optimal capital structures is a goal.
Even with more professional management, however, public and private capital lines remain separate. Short of a secondary market for private securities, there are still liquidity differences between the public and private markets because of built-in pricing differences. Many sophisticated private investors benefit from this arbitrage play. They are astute enough to invest in inefficient private companies at relatively cheap prices and, by dramatically increasing the size and sophistication of the companies, can exit these investments at much higher pricing levels.
The next section discusses the structure of private capital markets. It is offered as a guided tour through the bazaar.
PRIVATE CAPITAL MARKETS
The six broad categories of capital available in the private capital markets are called capital types. The capital types are:
1. Bank lending
2. Equipment leasing
3. Asset-based lending
4. Factoring
5. Mezzanine
6. Private equity
These capital types are segmented into various capital access points (CAPs). The CAPs represent specific alternatives that correspond to institutional capital offerings in the marketplace. For example, equipment leasing is a capital type whereas, captive-vendor, specialty, and venture leasing are examples of capital access points within that type. Exhibit 16.5 shows the capital types with corresponding capital access points.
EXHIBIT 16.5 Structure of Capitalization
| Capital Types | Capital Access Points |
| Bank lending | Industrial revenue bonds |
| SBA 504 loans | |
| Business and industry loans | |
| SBA 7(a) loan guaranty | |
| SBA CAPLine credit lines | |
| Credit lines | |
| Export working capital loans | |
| Equipment leasing | Bank leasing |
| Captive/vendor leasing | |
| Specialty leasing | |
| Venture leasing | |
| Asset-based lending | Tier 1 asset-based loans |
| Tier 2 asset-based loans | |
| Tier 3 asset-based loans | |
| Factoring | Small volume |
| Medium volume | |
| Large volume | |
| Mezzanine | Mezzanine |
| Private equity | Angel financing |
| Venture capital | |
| Private equity groups |
Accessing private capital entails three steps.
1. Determine the credit box of the particular CAP. Every capital provider uses a credit box to make lending and investment decisions.
2. Use CAP to define sample terms. These are example terms, such as loan or investment amount, loan maturity, interest rate, and other terms required by the provider.
3. Calculate an expected rate of return using the sample terms. This is the rate of return required by an investor for making the loan or investment. It is not enough to consider the stated interest rate on a loan. Other factors, such as origination costs, compensating balances, and monitoring fees, add to the cost of the loan.
Credit Boxes
This book employs credit boxes to describe access to most of the CAPs. Credit boxes embody the access variables a borrower must exhibit to qualify for the loan or investment. Unless a borrowing entity meets these criteria, it is not likely to be considered for a loan or investment.
Exhibit 16.6 illustrates the credit box for industrial revenue bonds (IRBs).
EXHIBIT 16.6 Credit Box for Industrial Revenue Bonds
To qualify for an IRB, an applicant must:
|
There is a significant variance in the nature of the credit criteria from CAP to CAP. The credit boxes of some capital access points are more qualitative, as shown in the IRB box in Exhibit 16.6. Many of the credit boxes are primarily quantitative, such as asset-based lending and factoring. Once again, each credit box indicates the criteria necessary to access that CAP.
Sample Terms
Once the credit box is shown, sample terms for most CAPs are illustrated. Sample terms are intended to reflect typical market terms for the CAP. With the proliferation of providers within each CAP, it is impossible to define sample terms for a CAP that represents the entire market. However, the various terms are discussed to help prospective users of credit generally understand each CAP. The sample terms for IRBs are shown in Exhibit 16.7.
EXHIBIT 16.7 Sample Terms for Industrial Revenue Bonds
| Example loan | $10 million. $2 MM Land/Buildings |
| $8 MM M&E | |
| Terms | 20 years real estate |
| 7 years M&E | |
| Interest rate | 2.5% (prime rate of 3.5% less 30%) |
| Letter of credit fees | 1% per year |
| Placement fee | 1% of loan amount |
The sample terms for each CAP show the example loan or investment amount with typical terms associated with the CAP. All of the terms are fully described in later chapters.
Expected Rates of Return
Finally, the expected rate of return is calculated, normally from the sample terms. This calculation can be complex, so the details of the computation are shown within each CAP. Exhibit 16.8 contains the expected rate of return calculation for the IRB.
EXHIBIT 16.8 Expected Rate of Return for Industrial Revenue Bonds

The stated interest rate of 2.5% is increased by the “terms cost” of 1.1%, which yields an expected rate of return of 3.6%. The interest rate and letter of credit fees are assumed to stay at the same percentages for the life of the loan. It is assumed that the placement fee is financed over ten years, with only the annual cost shown.
Two points must be made about the expected rate of return. First, this return is the expected rate of return to the provider. In other words, capital providers require a certain “all-in” return to compensate them for taking the risk of extending the credit or making the investment. This expected return is close to the effective cost to the borrower or investee. The major difference between the expected return to the provider and effective cost to the borrower are various transaction costs. For example, the borrower may incur legal, brokerage, environmental, and other costs in effecting the transaction. These costs are considered when calculating an effective or all-in cost to the borrower or investee.
Second, the expected rate of return to the provider may or may not represent a compounded rate of return. Except for mezzanine and private equity returns, the expected rates described in the book are determined on a noncompounded basis. In most cases, the difference between expected and compounded rates is small. This difference is apparent in the example in Exhibit 16.9 that compounds the industrial revenue bond cash flows.
EXHIBIT 16.9 Compounded Rate of Return for IRBs ($000)
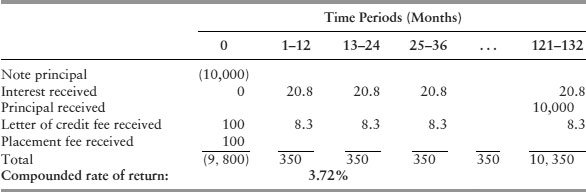
Assuming the provider receives the placement fee at time zero, instead of over ten years, the compounded return would be 3.72%. This compares to the 3.6% expected rate of return calculated earlier. It makes sense that the return to the provider is larger if it receives money from its investment sooner.
Expected rates are shown in this book because it is easier for the reader to duplicate the math as opposed to the more complicated process of compounding. Determining the compounded rate of 3.72% necessitates performing an internal rate of return calculation and requires a financial calculator or computer. The expected return calculations throughout this book can be accomplished by hand. This enables readers to replicate the math to suit their own circumstances.
PEPPERDINE PRIVATE CAPITAL MARKET LINE
Once all of the capital types are described and their expected returns determined, it is possible to graph the PPCML, shown in Exhibit 16.10. The PPCML is empirically defined, since the CAPM or other predictive models are not suitable for use in creating the expected rates of return in the private markets. Somewhere on or near this line is the expected return of the major institutional capital alternatives that exist in the private capital markets.
EXHIBIT 16.10 Pepperdine Private Capital Market Line
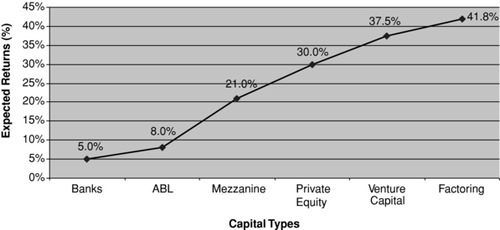
Exhibit 16.10 encompasses various capital types in terms of the provider's all-in expected returns. The PPCML is described as median, pretax expected returns of institutional capital providers. For consistency, the capital types chosen to comprise the PPCML reflect likely capital options for a lower-middle-market company. As shown in Exhibit 16.4, the PPCML could be created using different data sets.4
Throughout the capital chapters, return expectations are generated directly from the Pepperdine Capital Market Surveys or from sample term sheets that use data from the Pepperdine surveys. The marketplace is quite varied as to these returns. The “sample terms/expected returns” combination enables readers to understand the calculations.
Risk and return are matched more closely in private capital markets than previously possible. Most secured lenders receive a lower return than unsecured lenders. But private capital markets are still relatively inefficient in two major ways. In theory, private equity returns should form the highest part of the PPCML, since the investment risk is greatest. Exhibit 16.10 demonstrates that this is not the case. The most expensive capital type involves factoring, which should fall closer to asset-based lending in overall returns. The other inefficiency refers to the pricing between the capital types. In an efficiently priced market, the capital alternatives should be priced fairly close to each other, say 20 to 50 basis points (bps) apart. The PPCML can have 900-bps spreads or more from one capital type to the next. An example of this is the difference between the expected rates of return for mezzanine capital (21%) and private equity (30%). A 900-bps is unlikely in an efficiently priced market. The capital access points, with the corresponding expected rates of return (derived from sample term sheets), are listed in Exhibit 16.11.
EXHIBIT 16.11 Expected Returns by Capital Access Point (Prime = 3.5%)
| Capital Access Point | Description | Expected Return |
| IRBs | Industrial Revenue Bonds | 3.6% |
| 504 | SBA 504 loan | 4.0% |
| B&I | Business and Industry loan | 4.8% |
| 7(a) | SBA 7(a) loan | 5.8% |
| ABL 1 | Tier 1 asset-based loan | 6.2% |
| CAPLine | SBA CAPline credit line | 6.7% |
| Bank leasing | Bank equipment leasing | 7.0% |
| Captive leasing | Captive/vendor equipment leasing | 7.0% |
| ABL 2 | Tier 2 asset-based loan | 8.8% |
| Bank C/L | Bank credit line | 9.0% |
| EWCP | SBA export working capital program | 9.7% |
| Specialty leasing | Specialty equipment leasing | 10.0% |
| Venture leasing | Venture capital leasing | 16.5% |
| ABL 3 | Tier 3 asset-based loan | 17.3% |
| Mezzanine | Equity mezzanine capital | 19.5% |
| PEG | Private equity group | 30.0% |
| Factoring L | Large-volume factoring | 34.6% |
| V/C | Venture capital | 37.5% |
| Angel | Angel investing | 40.0% |
| Factoring M | Medium-volume factoring | 41.8% |
| Factoring S | Small-volume factoring | 49.5% |
Although all of these CAPs are described in detail in later chapters, next we present a brief summary of each CAP, in order of increasing expected return percentage.
- Industrial Revenue Bonds (3.6%). Industrial revenue bonds (IRBs) are municipal bonds whose proceeds are loaned to private persons or to businesses to finance capital investment projects. Even though they are municipal bonds, IRBs are not general obligations of the municipality. The municipality is not responsible for debt service, nor is it liable in case of default. The borrower has sole responsibility for paying the principal and the interest on the bonds. Exempt from federal income tax, IRBs have lower interest rates than most comparable capital sources. The bond proceeds can be used to finance entire projects, including land, buildings, and machinery and equipment. Finally, the terms of the agreement among the municipality, the bond buyer, and the borrower can be negotiated to conform to the needs of the borrower. (See Chapter 18.)
- SBA 504 Loans (4.0%). The Small Business Administration (SBA) works with certified development companies around the country who directly oversee the 504 program. A 504 project includes: (a) a loan from a private-sector lender covering up to 50% of the project cost; (b) a loan from the certified development company (CDC), backed by a 100% SBA-guaranteed debenture, covering up to 40% of the cost; and (c) a contribution of at least 10% equity from the small business. As of this writing, the maximum SBA debenture is $1 million for meeting the job creation criteria or a community development goal. (See Chapter 18.)
- Business and Industry Loans (4.8%). The Business and Industry (B&I) Guaranteed Loan Program helps create jobs and stimulates rural economies. This program provides guarantees up to 90% of a loan made by a commercial lender. Loan proceeds may be used for working capital, machinery and equipment, buildings and real estate, and certain types of debt refinancing. The primary purpose is to create and maintain employment and improve the economic climate in rural communities. This is achieved by expanding the lending capability of private lenders in rural areas, helping them make loans that provide lasting community benefits. (See Chapter 18.)
- SBA 7(a) Loans (5.8%). The 7(a) Loan Guaranty Program is one of the SBA's primary programs. It provides loans to small businesses unable to secure financing on reasonable terms through normal lending channels. The program operates through SBA-guaranteed, private-sector lenders. (See Chapter 18.)
- Tier 1 Asset-Based Loan (6.2%). Tier 1 asset-based lenders (ABLs) typically comprise the larger commercial banks’ ABL divisions. This tier usually requires a break-even earning capacity, although sometimes a negative earning capacity expected to turn positive is acceptable. Tier 1 ABLs also typically want initial fundings of at least $10 million and preferably more than $15 million. (See Chapter 20.)
- SBA CAPLines (6.7%). CAPLines is the umbrella program under which the SBA helps small businesses meet their short-term and cyclical working capital needs. (See Chapter 18.)
- Bank Leasing (7.0%). Banks are a major source of equipment leases. Because of their relatively cheap cost of funds, banks may offer the least expensive lease. Banks require a strong credit position and usually already have a lending or other relationship with the borrower. Banks are at a disadvantage when it comes to residual value of the equipment because they are not active players in the equipment market. Because of this, banks are not competitive when residual value is difficult to predict. (See Chapter 19.)
- Captive/Vendor Leasing (7.0%). Many large manufacturing companies provide financing to their customers, sometimes in the form of an equipment lease. Captive-leasing companies typically are divisions or subsidiaries of these manufacturers leasing only the larger company's products. Since captive lessors are generally part of a large company, their cost of funds tends to be low, making them highly competitive. (See Chapter 19.)
- Tier 2 Asset-Based Loan (8.8%). Tier 2 ABLs tend to fund riskier borrowers, that is, those that may have negative earning capacities but are expected to break even in the next year. As compensation for this additional risk, tier 2 ABL lenders require a higher interest rate than the tier 1 lenders. In a typical market, this interest rate is generally 1 to 2 points above the prime rate. Tier 2 lenders tend to be ABL divisions of midsize banks or independent arms of larger finance companies. Tier 2 ABLs prefer initial fundings of $3 million to $15 million but may bid on smaller deals if the possibility of strong loan growth exists. (See Chapter 20.)
- Bank Credit Line (9.0%). This is a standard credit line offered by a bank. The borrower pays interest on the money it actually borrows, instead of the committed amount. (See Chapter 17.)
- Export Working Capital Program (9.7%). The Export Working Capital Program (EWCP) provides short-term working capital to exporters. The SBA's EWCP supports export financing to small businesses when they cannot find loans elsewhere. The program encourages lenders to offer export working capital loans by guaranteeing repayment of up to $1 million or 90% of a loan amount, whichever is less. A loan can support a single transaction or multiple sales on a revolving basis. (See Chapter 18.)
- Specialty Equipment Leasing (10.0%). Some equipment lessors specialize in an industry or with certain types of equipment. These lessors have an advantage in situations where the underlying equipment has an uncertain secondary market (i.e., where specialized knowledge about equipment obsolescence creates a lessor advantage). Specialized equipment lessors may be more expensive than other lessor types at the outset, because of their higher cost of funds and the lack of reliance on residual value. However, for specialized equipment, this lessor ultimately may be cheaper than the other lessors. This is because this lessor works with the lessee over time and absorbs some of the obsolescence risk of the equipment. (See Chapter 19.)
- Venture Capital Leasing (16.5%). Venture leasing provides general-purpose equipment, such as computers, telecommunication systems, and office equipment, to start-up and early-stage companies. In exchange for the lease financing, the venture lessor receives monthly equipment payments, the equipment's residual value, and possibly equity warrants in the company. Even without accounting for the warrant cost, this lessor type may offer the highest-cost lease to lessees. (See Chapter 19.)
- Tier 3 Asset-Based Loan (17.3%). Tier 3 ABLs are driven less by the earning capacity of the borrower and more by collateral liquidation values. It is not unusual for tier 3 lenders to fund companies that do not expect to make money in the foreseeable future. Tier 3 lenders have the highest interest rates of the three tiers as well as the most restrictive lending arrangements. Tier 3 ABLs may loan less than $1 million per transaction but normally do not loan more than $2 to $3 million. (See Chapter 20.)
- Mezzanine Capital (19.5%). Mezzanine capital is subordinated debt that provides borrowing capability beyond senior debt while minimizing the dilution associated with equity capital. Mezzanine investors provide financing with a lower-than- adequate running yield but a higher equity kicker offsetting the risk-capital aspects of the investment. The trigger for the mezzanine investor is often the case in pre-IPO-situations, acquisitions of small and medium companies, and high-growth situations. (See Chapter 22.)
- Private Equity Groups (30.0%). Private equity groups (PEGs) are direct investors in the equity of private companies, especially in later-stage firms. PEGs tend toward control investments through recapitalizations or direct buyouts; however, many take a minority position in the right deal. (See Chapter 24.)
- Factoring, Large Volume (34.6%). This type of financing involves factoring relationships over $500,000 per month in volume. (See Chapter 21.)
- Venture Capital (37.5%). Venture capital is money provided by professionals who invest alongside management in early- to expansion-stage companies that have the potential to develop into significant economic contributors. Venture capital is an important source of equity for start-up companies. (See Chapter 23.)
- Angel Investing (40.0%). Angel investors tend to be wealthy investors who wish to participate in high-risk deals to satisfy some entrepreneurial urge and make a risk-adjusted return at the same time. (See Chapter 23.)
- Factoring, Medium Volume (41.8%). This type of financing involves factoring relationships between $100,000 to $500,000 per month in volume. (See Chapter 21.)
- Factoring, Small Volume (49.5%). This type of financing involves factoring relationships between $20,000 to $100,000 per month in volume. (See Chapter 21.)
This list describes most of the institutional CAPs available to finance private businesses. However, due to space limitations, not all CAPs in the private capital markets are discussed. An example is floor plan loans. Floor plans are used by various dealers to finance higher-priced items, such as automobiles, appliances, and boats. Floor planning enables dealers to maintain large inventory levels without making large out-of-pocket investments.
Floor plans typically are supplied by the finance company of a manufacturer. This arrangement solves several problems for the manufacturer. It enables the manufacturer to smooth its production schedule because dealers are required to take a certain number of units each month. Since dealers have minimal investment in the inventory, they can manage the inflows, even if it takes many months to sell. Manufacturers also make money on the financing relationship. In many cases, for example, the financing arms of automotive companies make more money than the manufacturing divisions. Finally, by flooding the market with numerous models, colors, and options, manufacturers are better able to service customers.
Although programs vary, in a typical floor planning arrangement, the lender advances a large percentage, sometimes 80% to 95%, of the cost of inventory but retains title to the assets. The finance company pays the manufacturer upon delivery of the inventory. This action also creates an outstanding loan balance to the dealer. To encourage aggressive marketing, manufacturers often incentivize dealers by offering interest-free periods or rebates through the financing company.
Dealers repay specific loans as the assets are sold. Failure to pay within the specified time may cause the dealer to be considered out of trust. This situation usually causes all of the floor plan loans to accelerate and, if left unresolved, may cause a termination of the financing relationship. Finance companies implement sophisticated inventory-control and repayment systems at dealerships to overcome miscommunications between the parties.
Floor plan financing is also available from banks and other lending institutions. However, vendors have more of a strategic interest to finance their goods than do outside lenders. Similar to vendor leasing, expected returns of vendor-supplied floor planning may be quite attractive since manufacturers make money from financing and manufacturing, and may subsidize the former activity.
Floor plan financing is not available to every private company. The type of business or its relationship with its vendors determines applicability. Companies that do qualify for this financing live in the details of these programs. Because these plans are used for a number of purposes and motives, there are no standardized expected returns from the capital providers. For all of these reasons, floor plan financing is not treated as a CAP and is not shown on the PPCML.
There are a number of noteworthy issues regarding the PPCML.
KEY ISSUES REGARDING THE PEPPERDINE PRIVATE CAPITAL MARKET LINE
The PPCML assumes transaction sizes of roughly in the range between $1 million and $50 million. Beyond $50 million, a borrower begins to have more sophisticated capital alternatives, such as loans from insurance companies and securitizations.
For presentation purposes, the expected returns plotted on the PPCML reflect a prime interest rate of 3.5%. Interest rate changes tend to affect the bottom half of the line (venture leasing and below) more than the top half (debt mezzanine capital and above). For instance, banks and asset-based lenders index to either the prime rate or LIBOR (London Interbank Offered Rate). The mezzanine and equity part of the private markets tend to require returns somewhat independent of interest rate indices. This fact can be corroborated by the behavior of high-yield players throughout the past 20 years. Regardless of the interest rate level or the other macroeconomic conditions, mezzanine investors require compounded returns around 20% while equity players require returns in the 30% to 40% range.
The PPCML is helpful when companies form or add to their capital structure. The financing goal of every company is to minimize its effective borrowing or investment costs. To achieve this, companies should walk the PPCML. This means borrowers should start at the least expensive lowest part of the line and move up the line when forced to do so by the market.
Some owners skip along the PPCML, incurring opportunity costs. An “opportunity cost” refers to the added capital cost to the company for not acquiring the least expensive cost of capital available. There is little reason to pay 34% for factoring, for instance, if tier 3 ABL is accessible at 17%. In this example, the company suffers an opportunity cost of 17 percentage points.
Many owners unknowingly incur opportunity costs. The cost of trade credit is laden with hidden opportunity costs. A brief example demonstrates how the timing of an invoice payment can result in an opportunity cost. Assume PrivateCo has a $1,000 invoice with payment terms of 2/10, net 30. If the firm does not pay within 10 days, it pays a finance charge of $20 for the use of the goods for the next 20 days. The effective cost of this decision not to take the discount is seen when viewed in annual terms. The next equation shows how to quantify the annual interest expense of this lost opportunity.
On an annual basis 2/10, net 30 costs approximately 36.7%, which puts not taking this discount in the same cost neighborhood as private equity and venture capital. Yet many owners forgo taking a discount rather than use a credit line to pay the invoice. Meanwhile, the credit line may have an expected cost of less than 10%. The opportunity cost of not taking the discount in this example is quite large. The key point here is for owners to consider costs of capital in a comparative setting. The PPCML is a tool for focusing this thought process and, hopefully, reducing opportunity costs.
CAPITAL STRUCTURE TREATMENT
A number of assumptions and perspectives guide this book's treatment of capitalization. Various capital categories are described as capital types. The capital types are then broken into specific alternatives, or CAPs. The other major perspectives are presented next.
First, keep in mind that this is not a how-to-write-a-business-plan book. Many such books already exist, most of which can be located with an Internet search. The key premise for borrowers to attract capital is to demonstrate that the capital provider gets the required return with the least risk possible. As long as the presentation focuses on this risk/return correlation, the investee is well served.
Second, this is not a list-of-capital-providers book. Within each capital type, there are sometimes thousands of different capital providers, and they change daily. The Internet contains up-to-date lists.
Third, the PPCML describes the expected rates of return required by various capital providers. This line is stated on a pretax basis, from both a provider and a user perspective. In other words, capital providers offer deals to the marketplace on a pretax basis. For example, if a private equity investor requires a 35% return, this is stated as a pretax return. Also, the PPCML does not assume a tax rate to the investee, even though many of the CAPs use interest rates that generate deductible interest expense for the borrower. CAPs are not tax-effected because many owners of private companies manage their company's tax bill through various aggressive techniques. It is virtually impossible to estimate a generalized appropriate tax rate for this market.
Borrowers should consider the tax-deductible features of CAPs when making investment decisions, however. Fortunately, this is just a matter of using the information provided in the chapters and applying a specific tax rate.
Finally, the required or expected returns of private capital providers are different from returns actually realized. Investors hope all of their investments live up to expectations. Of course, the end result is often quite different. Exhibit 16.12, taken from data published by Thomson Reuters, shows actual returns for a variety of private equity sources.5
EXHIBIT 16.12 Thomson Reuters U.S. Private Equity Performance Index (PEPI)*

The Private Equity Performance Index is based on the latest quarterly statistics from Thomson Reuters’ private Equity Performance Database analyzing the cash flows and returns for over 2,044 U.S. venture capital and private equity partnerships with a capitalization of $982.6 billion. Sources are financial documents and schedules from limited partner investors and from general partners. All returns are calculated by Thomson Reuters from the underlying financial cash flows. Returns are net to investors after management fees and carried interest.
Exhibit 16.12 shows riskier investments return more than less-risky investments. For example, early/seed venture capital returns more than later-stage venture capital, which itself returns more than mezzanine capital.
Yet a substantial difference exists from these realized returns and the expected returns discussed earlier. This chapter suggests that mezzanine capital providers seek expected returns of about 20%, buyout firms (PEGs) expect returns of about 30%, and venture capitalists target approximately 40% returns. Over a 10-year period, the realized returns for these groups are 2%, 3%, and (1.5)%, respectively. What explains these rather large differences between expected and realized returns?
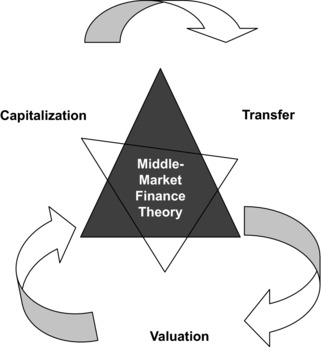
EXHIBIT 16.13 Triangulation
Perhaps most of the difference lies in the nature of picking winners in the private capital markets. Given the uncertainty surrounding the companies that qualify for private equity, providers may need to shoot for 30% to actually receive a positive return (although 3% is not an acceptable risk-adjusted return). There may be insufficient information about the investee's prospects at the time of the investment for the capital provider to make winning decisions. Whatever the reasons for the difference, companies in need of private capital are subjected to the provider's expected returns, not realized returns, when the deal is structured.
Private capital markets are fairly inefficient, in terms of both capital access and pricing consistency. There is a structure to this market, however. Institutional capital alternatives are identifiable and definable. A handful of capital types comprise dozens of CAPs. Access to CAPs is determined through credit boxes. Sample terms indicate likely deal terms. Expected rates are calculated from the sample terms and represent the return required by the capital providers. Finally, the expected rates are graphed to form the PPCML.
TRIANGULATION
Capitalization is dependent on the value world in which the company is viewed and the availability of transfer methods. Triangulation is graphically depicted in Exhibit 16.13. Specific CAPs are linked to value worlds. Once located within a value world, a company's value can be determined. Capital availability affects transfer options and pricing. The type of capital employed by a company directly impacts its transfer alternatives.
The lower half of the PPCML is tied to the world of collateral value. Secured lenders rely on collateral of a borrower to make credit decisions. Mezzanine lenders and private equity providers primarily look at the company through the world of market value to make investment decisions. It is important to understand through which value world a capital provider views the company since, in the eyes of the provider, the company has value only in that world. For instance, a bank will not view the subject in the world of market value because, if liquidation occurs, the bank must look to the company's assets for repayment.
Equity availability affects the firm's value. Limited access to equity necessarily impairs access to debt and thereby limits growth. The return expectation of institutional private equity is too high to allow a company to grow on equity alone. Achieving these return expectations requires leveraging equity and debt. If an owner cannot or will not increase equity, others are unlikely to invest equity or debt. The equity portion of a firm's capital structure affects its ability to attract debt, its ability to grow, and ultimately, its value.
The availability of capital to finance private transactions is a driving force behind private acquisition multiples. Debt typically constitutes 60% to 70% or more of a buyer's capital structure. Access to debt affects an acquirer's ability to price an acquisition.
Consider service industries, which do not rely on large asset bases to generate earnings. Contractors and professional service providers fit into this category. Due to the lack of a collateral base and reliable income streams, senior lending is quite limited in these industries. As a result, the pricing multiples for these businesses tend to be less than for companies in asset-heavy industries. For example, a contractor may sell for three times its benefit stream, as compared to four to seven times for a proprietary manufacturer.
NOTES
1. The public capital markets line shown in the text depicts expected returns for investors in the largest public companies. Further, this line is presented in a historical context. The actual line may vary significantly from the presentation based on market conditions.
2. John D. Emory, “Expanded Study of the Value of Marketability as Illustrated in Initial Public Offerings of Common Stock,” Business Valuation News (December 2001), pp. 4–20.
3. John K. Paglia, Pepperdine Private Capital Markets Project Survey Report, April 2010, bschool.pepperdine.edu/privatecapital.
4. Ibid.
5. Thomson Reuters Corporation, thomsonreuters.com, August 10, 2010.