
Your ability to track community engagement depends to a large degree on the nature of the community platform. As we’ve seen, when you run the platform you have far more insight into how your community engages with you. Because you control site design and the insertion of JavaScript, you can use many of the tools we’ve seen in earlier chapters, particularly web analytics, to understand the degree of engagement you’re seeing within a community.
On the other hand, when you’re merely a moderator or participant, measuring community engagement can be difficult.
As Figure 14-42 shows, you can think of a community’s members as moving through eight levels of engagement, from their first impressions of the community all the way to the moment when they become active participants.

Any visitor who encounters a community gets an impression. If she doesn’t see something of use, she will leave. Such visits typically last less than five seconds, and show up as bounces on your website (Figure 14-43). Of course, if you’re not running the platform, you won’t have any idea what the bounce rate of your messages is—you simply won’t see activity, such as upvoting or comments, around the content.
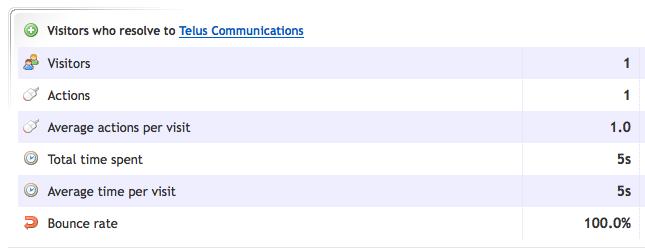
Figure 14-43. Comparing a visitor who failed to be impressed (and had only a single impression lasting five seconds) with the rest of your visitors
You’ve reached a visitor when he discovers your community and reads or interacts with content he sees there. Having found the content he wanted, there’s little guarantee he will return. His visit includes only one page, but the average time on the page is greater than that of a bounced visit.
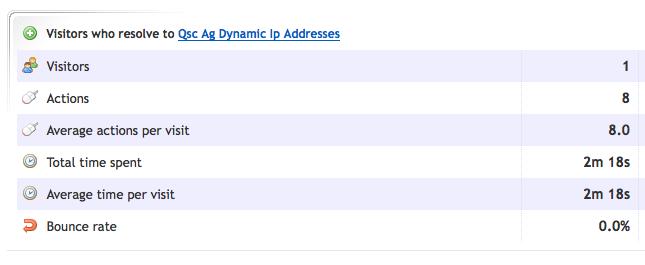
Visitors who navigated within the community website found a reason to stick around. They either had to navigate for their content or were intrigued by what they saw and wanted to see more. But they weren’t interested enough to flag the site for future use (i.e., by bookmarking it) or to opt in for notifications about future content. These show up in traditional analytics tools as first-time visitors who saw more than one page (Figure 14-44).
Users who come back to the site over time are more committed than those who use it once. Browser cookies can measure this aspect of the community’s visitors; if your blog uses a cross-blog commenting system, you may be able to spot returning visitors, too. Reports on new versus returning visitors show how likely community members are to return.
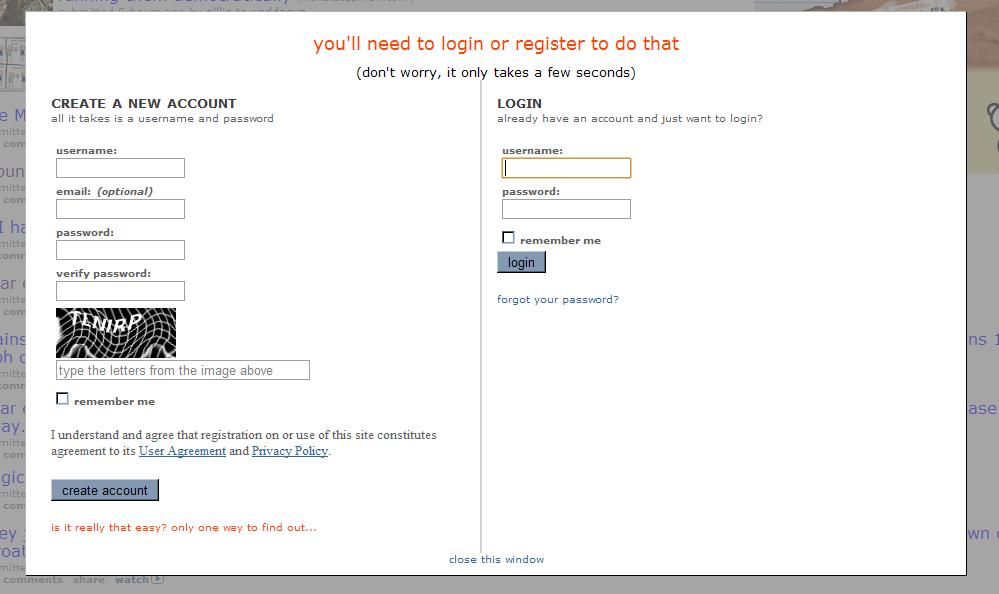
Enrollment happens when a visitor provides credentials or tries to establish a relationship with the community. This may mean that she creates an account (as shown in Figure 14-45), subscribes to an RSS feed, or joins a mailing list.
For social sites, enrollment occurs when a member connects with you. This may involve someone following you on Twitter or joining your group on Facebook. In these cases, you’ll see who these users are, and they’ll be added to your tally of friends or your social graph.
On the other hand, for sites such as social news aggregators, you won’t know users are enrolled until they contribute or comment on content within a subreddit.
Enrollment means establishing a connection; engagement means using it. A friend who sends you a message, a reader who comments on a blog, or a mailing list recipient who posts to the mailing list, is engaged. This may also be the act of upvoting or rating a submission (though this is harder to measure).
Users don’t always have to enroll to engage you, however. They may interact with you in other ways—letting you know about inappropriate content, responding to a question via email, or responding to a survey, for example.
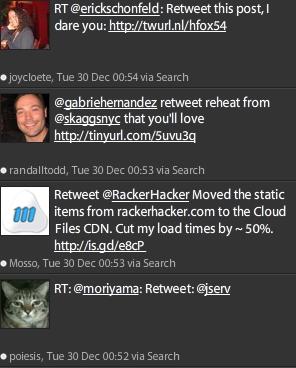
Community members who help spread your message are further down the funnel. This may consist of discussing your content on other platforms, submitting it to a social news aggregator, reTweeting it (as shown in Figure 14-46), or mentioning it in a message or blog post. If your platform offers tools to help members invite others, members may also be willing to tell their social network about you directly by sending invites. This is a higher level of engagement that indicates brand trust, and is a sure sign of fledgling brand advisors.
As with all web analytics, community members are most engaged when they reach a business outcome. This is the return on community—it’s where you get a financial benefit from your investment. It may be a customer getting help from a fellow community member rather than calling your support department. It may be a journalist contacting you because she heard about you. It may even be a product recommendation or a purchase. Whatever your conversion goals, this is the end of the funnel.