
Any visit can be broken into three distinct stages: finding the website, using the website, and leaving the website. Web analytics is the science of identifying segments of your visitors that go through these three stages in significantly different ways, and then focusing on segments that are the best for your business.
If a certain marketing campaign helps people find your site, all else being equal, you should put more money into that campaign.
If a certain kind of site content or layout encourages visitors to use your site in ways that are good for your business, you should focus on that content.
If certain content, layout, or page load speeds encourage users to stay longer and return more often, you should focus on doing those things more consistently.
If certain ad locations encourage your visitors to click on those ads, generating revenue for you as they leave the site, you should charge more for those locations and sell more of them.
Getting traffic to your site is often the first thing marketers think about. If all else is equal, more traffic translates into more revenues and a healthy business.
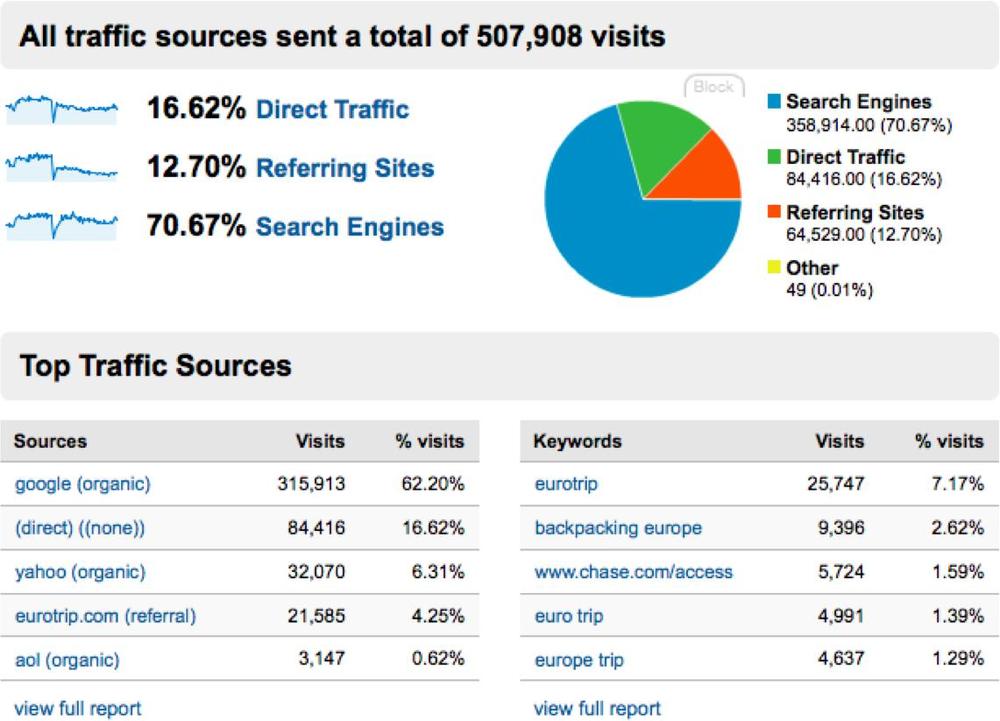
Of course, all else is seldom equal. In addition to search engines, visitors come from a wide range of sources (shown in Figure 5-18), among them hundreds of social networks. Each visit has a different outcome. Some visitors stop by briefly, never to return, while others become lifelong readers or loyal customers.
By optimizing the step before users hit the entry page, you can increase traffic volumes, which makes for a larger conversion pool. Let’s look at the ways users come to your website.
Note
It’s important to make the distinction between an entry page and a landing page. The entry page refers to the first page a visitor loaded for a visit to your site. However, a visitor might hit multiple landing pages during a single visit. How is this possible? A visitor may navigate into your site initially (making this both the entry page and the landing page), then navigate away to another site, and finally return to your site in a relatively short time frame while their session cookie is still valid, making it seem like the second landing page was part of the visit. In other words, there can be multiple landing pages but only one entry page.
Visitors can find your site in several ways:
They can type the URL into the browser directly, known as direct traffic.
They can link to you following an organic search.
They can click on an advertisement or sponsorship link, which counts as banner or paid search campaign traffic.
They can follow a link from another site or from a community such as a social network through referrals.
They can respond to an email invitation as part of an email marketing campaign.
Each of these sources is treated differently in web analytics.
The simplest way for people to visit your website is by typing it into an address bar. They may have heard your brand name and decided to enter it as a URL, or they may have seen the URL in print advertising.
Direct traffic is the least informative of all traffic sources, because you don’t know how the visitor discovered you. As a result, it’s hard to optimize. If you need to know more about these visitors, intercept them with a survey and ask them how they found out about your site. We’ll look at VOC surveys in Chapter 7.
Direct traffic can also be misleading for several reasons:

Figure 5-19. Navigational search results for www.farmsreach.com; high levels of navigational search for the URL can be an indicator of a nontechnical demographic
- Navigational search
Between 15 and 20 percent of web searches consist of users who type a URL into the search engine (rather than the browser’s address bar). A surprising number of Internet users believe that this is how the Internet works, and only ever use searches to find sites, even those they frequent every day. In these cases, the URL of the website—or its name—appears in keyword reports, as shown in Figure 5-19. This is known as navigational search, and will usually be shown as organic search traffic rather than direct traffic.
- Type-in traffic
Type-in traffic occurs when a user types a word—such as “pizza”—into a search engine to see what will happen. Depending on the browser or search engine, this will often take the user to a named site such as “www.pizza.com” that makes its money from referring visitors to other sites. Type-in traffic is why popular type-in domains are sometimes sold for millions of dollars.
Note
John Battelle has an excellent write-up on the type-in traffic business at http://battellemedia.com/archives/002118.php.
- Bookmarking
Users who have visited a site may bookmark it, or the browser may display the most frequently visited sites when it is first launched. Clicking on a bookmark, a “frequently visited” link, or a link in the browser creates a visit with no referring site. The visit is classified as direct traffic by the analytics engine.
- Desktop client
Some desktop tools, such as Twitter and email clients, don’t provide any information about a followed link—they simply launch a web browser with a URL that the user received through the desktop tool. As a result, these links are classified as direct traffic, even though they were referred through a community.
- JavaScript redirection
If a user follows a JavaScript-triggered link to your site, the browser might not pass on referring information and the visit will be mislabeled. Careful scripting can fix this, but few web developers make the extra effort.
- Browser inconsistency
Browser behavior can reduce the accuracy of direct visitor count. For example, in certain conditions, Microsoft’s Internet Explorer 7 will not pass along referring information if you load a website in another window or tab.
- Bots, spiders, and probes
Scripts and automated visitors, such as search engines indexing your website, may not be properly identified and may be counted as direct visits.
These caveats mean that direct traffic counts can be inaccurate. You can mitigate some of this inaccuracy through the use of custom URLs that make it easier to track the effectiveness of a traffic source. For example, in a print campaign, you can include the name of a specific magazine in the URL that you place in that magazine’s ads (i.e., www.watchingwebsites.com/magazinename). Then you can track the success of advertising in each magazine by segmenting visits within analytics by the URL.
One of the most common ways people find a site is through organic, or unpaid, search. A web user enters a search term and clicks on one of the results, as shown in Figure 5-20. The referring URL includes not only the site that referred the user, but also the search terms that drove the traffic to your site.
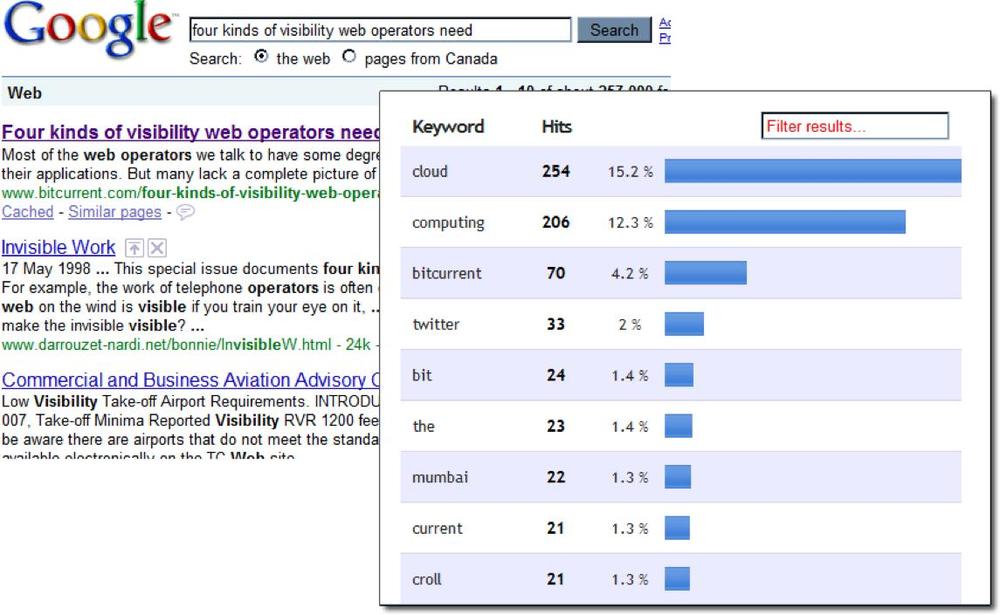
Over time, your web analytics package develops a list of the most common keywords driving traffic to your site. Some of the keywords that drive traffic can be quite weird and unexpected, as shown in Figure 5-21, and may be a clue that your visitors’ intentions on your site aren’t what you think they are, and are worthy of further investigation.

If search engines consider your content more relevant, your site will rank higher than others and appear higher in search results. Many factors influence this, such as the text and metadata on your site and the number of other sites that link to yours.
As an online marketer, one of your main jobs is to ensure that your site content is ranked highly and that the right organic search terms send traffic to the site. Web analytics helps you to understand whether your site is properly optimized and which keywords are driving traffic, through reports like the one in Figure 5-22.
Note
The art of search engine optimization (SEO) is interesting, fun, and not covered in this book. We would rather leave you in the hands of the masters. For a great start in understanding SEO ranking, check out www.seomoz.org/article/search-ranking-factors.
Either way, the ultimate goal is to get better visibility and more qualified traffic.

If you’re not getting the attention you want organically, you can always pay for it. According to the Interactive Advertising Bureau, online advertising is a $21 billion-dollar industry. Three kinds of ads, shown in Figure 5-23, make up the bulk of online advertising:
Pay-per-impression, in which advertisers pay media sites for the number of times they show an ad to a visitor.
Pay-per-click, in which the media site gets paid each time a visitor clicks on the advertiser’s message. This is how paid search ads work.
Pay-per-acquisition, in which the media site is compensated each time a visitor that they send to an advertiser completes a transaction. Affiliate marketing is an example of a pay-per-acquisition model.
The ads may be shown to every visitor or they may be selectively displayed according to keywords and their relevance to search engines.
Pay-per-impression advertising is declining, with the possible exception of video advertising. One of the main reasons for this is fraud: marketers prefer to pay for outcomes, and pay-per-click reduces the amount of fraud that they have to deal with. There is also good evidence that picture advertising doesn’t encourage users to click on it, so paid search is the most popular form of online advertising today.
Ad payment models vary by advertiser, but are often built around keyword “auctions” and a daily budget for each ad buyer. Ad prices are established by advertisers competing for a keyword.

Figure 5-23. The three models of web advertising–pay-per-impression, pay-per-click and pay-per-acquisition
Google’s AdWords, Microsoft’s adCenter, and Yahoo!’s Search Marketing display paid ads alongside organic search results. So if you can’t optimize your site well enough to qualify for a spot on the first page of their search results, you can still get some real estate on a page of organic results by paying them.
A referral occurs when someone mentions your website, which may happen in a blog posting, a mention on a social news aggregator like Digg, a Facebook status message, and so on.
Many online retailers offer affiliate marketing programs that compensate others for sending them traffic. For example, a blogger might recommend books to her readers, and will be compensated by Amazon.com every time someone follows one of her links and buys a book, as shown in Figure 5-24.
For this to work, the referring link includes an affiliate ID—a code that uniquely identifies the referrer so that she can be credited with the referral.

Figure 5-24. Affiliate marketing and paid search on book sharing site LibraryThing showing the unique affiliate URL that identifies the referring site
While referrals do come from a somewhat trusted source, paid referrals have a different URL, and many web users can differentiate between a free referral and a paid affiliate marketing link. Paid referrals work well when the source is trusted and users don’t mind that the referrer is being compensated, but they’re less genuine than simple, unpaid word of mouth.
There’s a form of referral that is specific to blogging. When one blogger references another, the referencing blog alerts the referenced blog that a linkback (or trackback) has occurred. This is a form of attribution that’s built into most blogging systems.
Figure 5-25 shows how a linkback works.
The author of Blog A writes a blog post.
The author of Blog B mentions A’s post in a blog entry he writes, triggering a linkback mechanism on his blogging platform that informs Blog A of the inbound link.
Blog A’s blogging platform updates the linkback section of the post to include the inbound link from Blog B.
A visitor to Blog A reads the post, including the linkback section.
The visitor clicks the linkback from Blog B.
The visitor sees the post on Blog B that referenced Blog A.

Linkbacks help make blogging dynamic and encourage cross-referencing and attribution of ideas, as shown in Figure 5-26. They allow readers to follow extended conversations between several bloggers.
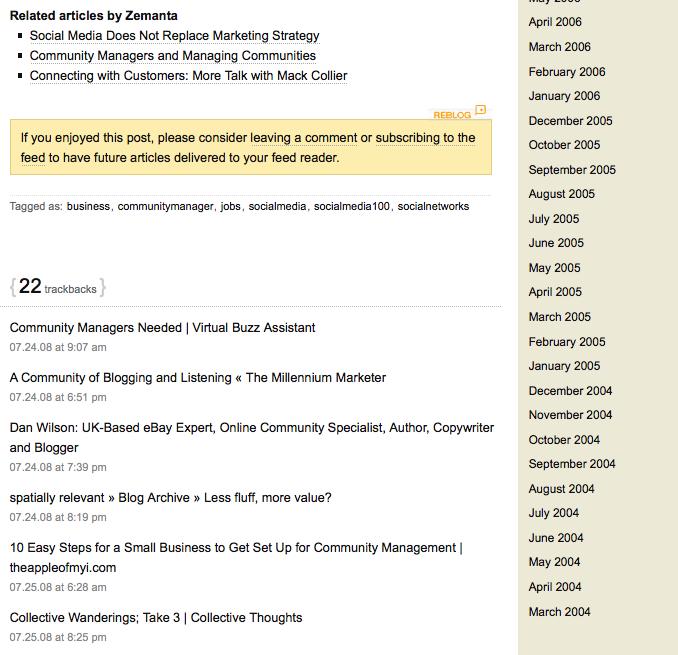
If you’re running a blog, linkback analysis is another form of referral analytics you need to track.
Once you’ve identified visits that came from organic and paid search, advertising campaigns, affiliate referrals, and linkbacks, you’re left with direct traffic. Much of this comes from word-of-mouth mentions and social networks—after all, visitors had to hear about you somewhere. However, you can’t tell where their first impressions came from, because their visits are the result of several influences you weren’t monitoring.
The conversion funnels we’ve seen so far begin when a visitor first arrives at your site. This isn’t an accurate model for the modern Web. Social networks and online communities mean conversion starts long before a visitor reaches your site. Integrating all of these into your understanding of the conversion process is a major challenge for web analysts.
All of these traffic sources represent your “long funnel”—the steps your visitors undergo from initial awareness to conversion—which begins at the conversation prism (by Brian Solis and JESS3, found at http://theconversationprism.com).
What happens when users first become aware of your brand on another site affects their conversion once they reach your site. Consider, for example, two visitors from social news aggregator reddit. One visitor may follow a link from the site’s home page, while another may read critical comments about your brand within the submission’s discussion. Their outcomes on your site are affected by experiences that happened long before they ever saw your home page.
The start of the long funnel is the subject of community monitoring, which we’ll look at in Chapters 11 through 14. It’s hard to tie community activity to web funnels, in part because of privacy concerns, but long funnel analysis is the holy grail of web analytics and a critical factor to consider in organic traffic acquisition.
Now that we know where users come from, let’s figure out what they’re doing on your site.
You track what your visitors do so that you can identify patterns and improve the site in ways that increase the outcomes you want (such as inviting friends, creating content, or subscription renewals) while reducing those you don’t (such as departures or calls to customer support).
The first page in a visit is particularly important. Different visits have different first pages, and you can segment outcomes based on the pages at which visitors arrive. You may even have different landing pages for different traffic sources, which lets you tailor your site’s message to different segments.
For example, a visitor from reddit might see a message or layout that’s designed to appeal to him, while a visitor from Twitter might see a different layout entirely.
To understand what visitors first saw, run a Top-N report on entry pages, such as the one shown in Figure 5-27, to see some fundamental facts about your website:
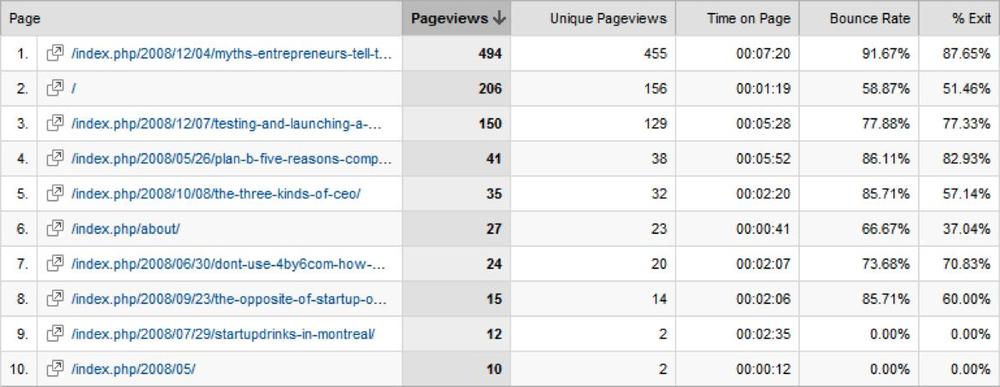
The total number of page views for the page.
The number of unique page views for the page. Subtracting total page views from unique page views shows you how many visitors viewed a page more than once.
The time visitors spent on the page before moving on.
How many visitors arrived at the page and left immediately.
How many visitors ended their visits on the page.
Armed with just this information, you already know a great deal about which parts of your site are working.
If your objective is to engage visitors, you want create more pages like those that make visitors linger (lingering indicates visitors found the content useful) and that encourage them to go elsewhere within the site.
If the page has a high bounce rate, you may need to redesign the page to convince visitors to stay.
If users exit from this page, you’ll need content that draws them back into the site for more than one page by suggesting they enroll or view additional content.
To understand visitor activity beyond the first page, start thinking in terms of places and tasks. Your visitors have arrived at a place on your site, such as the landing page, and can do various things in that place. They can remain there and interact, they can move to another place, or they can complete some kind of task. Figure 5-28 shows an example of a places and tasks diagram for a social news aggregator.
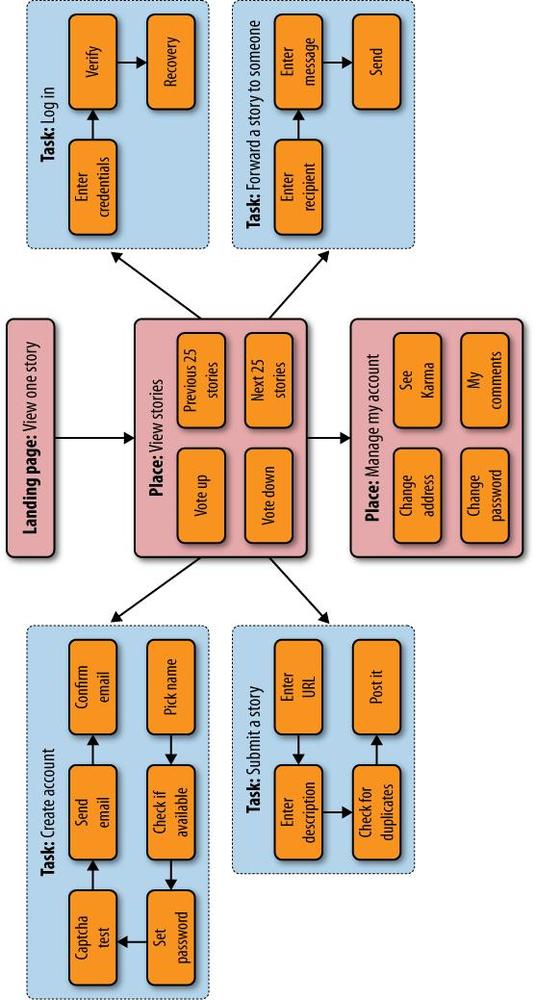
The places and tasks model lets you define all the outcomes you want on your site so that you can collect data on them.
For places, you care about all-purpose metrics such as exit rate and time spent in the place, as well as where visitors went after each place. You may also have site-specific metrics (for example, number of story votes a visitor placed) that measure productivity, engagement, or value derived from the user’s visit.
For tasks, you care about progress toward an outcome, and abandonment at each stage. If, for example, a visitor sets out to forward a story to someone, you need to track the many ways in which the task can go awry: the entry of an invalid email address, the visitor abandoning the process, the mail not being delivered, or invitees not acting on mail they’ve received.
Try to assign each task a dollar value. For e-commerce transactions, this may be the money the visitor spent, but for other kinds of task it may vary. If you have an estimate of the lifetime value of a customer, a completed invitation may have a specific dollar value based on that estimate.
Assigning a dollar value is good for three reasons. First, it makes the somewhat esoteric analytics data concrete: everyone knows what a dollar is. Second, it forces you to quantify how the task outcome helps the business. Third, it makes executives pay attention.
Other examples of tasks you want to track include:
Adding a contact to a CRM database
Commenting on a blog post
Subscribing to an RSS feed or mailing list
Getting directions or contact information
Downloading product literature
You need a map of the places and tasks, with key performance indicators (KPIs) for each action. Once you know what these are, it’s time to test and segment your website to maximize those KPIs.
All visits are not equal. You need to compare different visitor groups to see which do better or worse than others. Table 5-1 shows some examples of segments by which you may want to analyze your traffic.
Table 5-1. Different ways to segment data
Note
Some segmentation data isn’t available directly through analytics, and you may need to use customer surveys or enrollment questions to fit visitors into a particular segment—such as those over the age of 40—so that you can analyze a particular KPI or outcome by that segment.
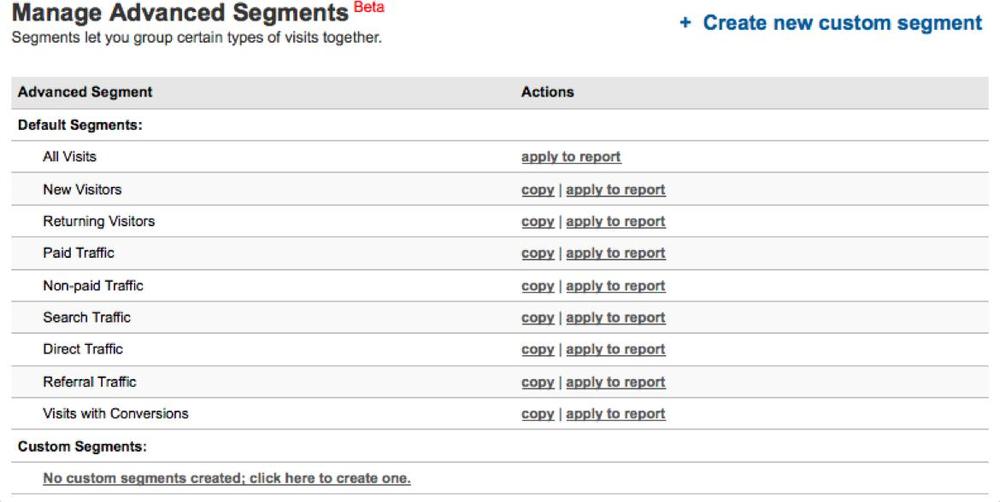
While analytics tools offer many built-in segments, you can create custom segments according to user-defined data or other fields within an analytics tool to slice up traffic in ways that matter to your business, as shown in Figure 5-29.
By comparing KPIs across segments, you can identify what’s working and what’s not. You might decide that one advertisement works while another doesn’t, or that one offer encourages visitors to linger while another makes them leave.
The ultimate KPI is the goal, or outcome, of a visit. Within your analytics package, you identify the outcomes you want, such as a purchase confirmation page or an enrollment screen, as well as any steps leading up to that outcome. This is often visualized using a funnel graph (Figure 5-30).
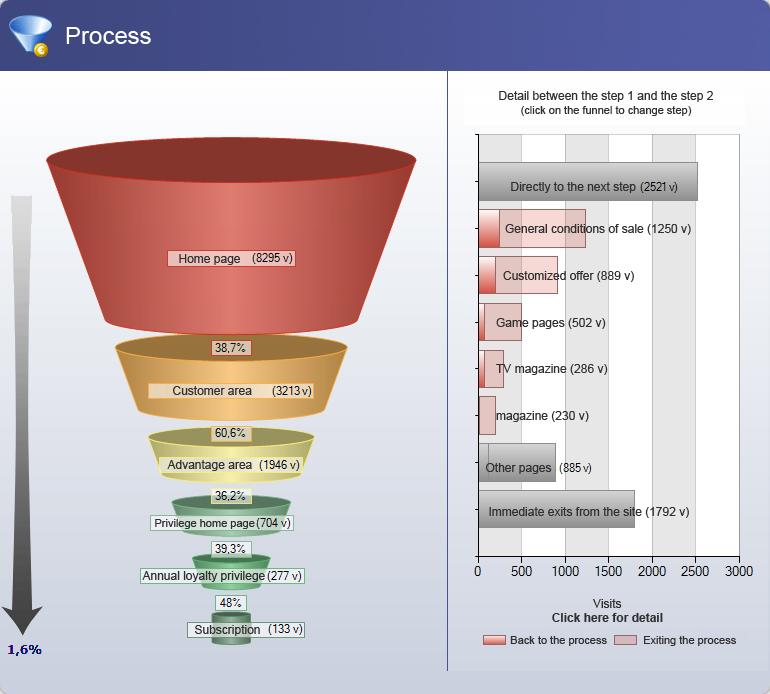
Funnels work well, but they’re myopic. They make it hard to identify where users are going, and don’t take into account reentry into the process. They also focus on web activity alone, while many websites have goals that include email messages, subscriptions, and other steps that can’t easily be captured by simple web requests.
As web analytics tools adapt to today’s more distributed conversion processes and usage patterns, we’ll likely see places-and-tasks models that track KPIs for each step in a process. The KISSMetrics ProductPlanner (shown in Figure 5-31) is a great resource for determining which metrics to capture for many popular web design patterns.

Figure 5-31. Twitter’s sign-up process with the associated metric important for this step in the funnel on ProductPlanner
The core of web analytics is knowing what outcomes you want, describing KPIs that represent those outcomes, scoring various visitor segments against those KPIs, and testing various combinations of content and segments to maximize those KPIs. Despite your best designs and offers, however, visitors often won’t do what you wanted—they’ll leave. Knowing why they left—and where they went—is equally important.
While you can’t see a visitor’s activity once she’s left your site, you can tell a lot about her motivations by looking at the last things she saw. You can also intercept parting visitors with a feedback form to try to learn more about their departure, which we’ll look at more closely in Chapter 7.
Abandonment happens when people leave your site before doing something you wanted them to. They may simply leave out of boredom, because of an error or performance issue, or because they changed their minds about completing a particular task.
In recent years, analytics tools have started to look within a single page, to the form elements on that page, in an effort to identify which components of a page drive visitors away.
Consider, for example, a form that asks for personal information such as age. If you analyze the abandoned page at the page level, you won’t know that it’s a specific form element that’s the problem. However, if you use web interaction analytics (WIA) tools to do form-level analytics, you’ll have a much better understanding of how visitors are interacting with the site, as shown in Figure 5-32.

Figure 5-32. While web analytics looks at page-by-page abandonment, visitors usually abandon a process at a specific form element
We’ll look at WIA in more detail in Chapter 6. For now, remember that abandonment is a coarse measurement and there are ways to perform more detailed analyses of where you’re losing visitors.
Bounce rate is a close cousin to abandonment. Visitors “bounce” when they enter your site and leave immediately. Bounce rate can mean that visitors didn’t find what they expected to find, which may be a sign that search engines aren’t properly indexing your content or that you’re buying the wrong search keywords. For news sites, blogs, and certain content sites, a high bounce rate may be normal—visitors come to read one new article, then leave. Focus on encouraging visitors to bookmark your site, return, share content with others, and subscribe. You should care more about lifetime visitor loyalty than about one-page visits.
Unlike bounces and exits, which happen at the end of a visit, attrition happens when your relationship with a visitor grows stale. There are many ways to measure attrition. You might look at the percentage of returning visitors, but if your site is acquiring new visitors, a declining percentage of returning visitors might simply indicate rapid growth.
A better measure of attrition is the number of users that haven’t returned in a given period of time. By comparing attrition for two time periods, as shown in Figure 5-33, you can tell whether things are getting better or worse, and whether you’re successfully retaining visitor attention.

Figure 5-33. A comparison of last visits by user population, showing a reduction in visitor disengagement and attrition from one month to the next
Many community sites celebrate the number of visitors they have without considering the engagement of those visitors. Any site that depends on user activity and returning visitors must look at attrition carefully and make concerted efforts to reengage users who haven’t visited the site in a long time.
While abandonment is a bad thing, not all departures are bad.
Visitors might leave your site once they’ve done what they wanted. Perhaps they’ve successfully completed a purchase, at which point they’ve finished their transactions. Your work’s not done: you need to learn more about why they bought what they did through surveys, and to encourage them to enroll and return.
Visitors may also have enrolled or subscribed, preferring to hear from you via RSS feed or email subscription. If this is consistent with your business model, it’s a good thing. You do, however, still need to monitor whether they’re receiving and acting on email messages that you send them or returning when you add new content to your RSS feed to ensure that the enrollment “stuck.”
You may have sent the visitor elsewhere through a paid referral or an ad, in which case you’re making money from the departure. An ad referral is a complex dance between your media website, the ad serving network, and the advertiser to whom a visitor eventually connects. Figure 5-34 shows how this works.

Your web page contains a reference to content from an ad inventory provider. This content includes a link to the ad network (such as http://pagead2.googlesyndication.com/pagead/iclk) that contains a unique identifier for the ad and the destination site’s URL.
The visitor’s browser loads the ads that are on the page from an ad serving network, and if the visitor clicks the ad, the network records the click before sending the visitor to the destination (the advertiser’s site).
This model doesn’t let you count how many ads visitors clicked. As a result, you don’t have your own numbers to compare to the ones the ad network tells you—in other words, you’re letting the company that’s paying the bills say how much it owes you. Not good.
To resolve this issue, you can add JavaScript to your pages to let you know when a visitor clicks an ad, then compare your measurements to the advertiser’s numbers in order to resolve any disputes. This additional step is reflected in Figure 5-35 (visit www.google.com/support/analytics/bin/answer.py?answer=55527&ctx=sibling for details on using this for the Google Analytics JavaScript).

Figure 5-35. Capturing ad click events and sending them to your analytics service lets you count clicks on embedded ads
If you’re running a sponsored site where advertisers pay for a time period or banner placement, you may be inserting advertising or banners on behalf of your sponsors. To track clicks you can either first redirect the visitor to an intermediate page that records the action or you can use JavaScript to send a message to your analytics system.
You can also do this if you’re letting visitors download non-HTML content, such as Adobe PDF documents, since the document you’re sending them can’t execute JavaScript to let you know it was downloaded. Analytics tools can track requests for this intermediate page, giving you ad-tracking data as shown in Figure 5-36 (visit http://www.google.com/support/analytics/bin/answer.py?answer=55529&ctx=sibling for information on using this for Google Analytics).
