
To study and analyze project performance, you can apply one of three earned value tables to a sheet view. You can run the Earned Value reports. You can also add selected earned value fields to any sheet view.
With a baseline set and actuals entered, you can evaluate current cost and schedule performance through earned value. To review your earned value information in a view, do the following:
Click View, More Views. Click Task Sheet and then click Apply.
Click View, Table, More Tables.
The More Tables dialog box appears.
In the Tables list, click Earned Value and then click Apply.
The earned value data for your project displays (see Figure 13-2).
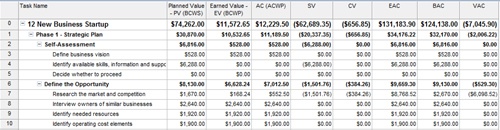
Although the Earned Value table shows the majority of the earned value fields, two other tables help you focus on specific types of earned value information. Apply the Earned Value Cost Indicators table to analyze your project for budget performance. Apply the Earned Value Schedule Indicators table to analyze schedule and work performance. The fields included by default in each of the three earned value tables are shown in Table 13-1.
Table 13-1. Earned Value Tables
Table name | Included fields |
|---|---|
Earned Value | Planned Value (PV), also known as BCWS (Budgeted Cost of Work Scheduled) |
Earned Value (EV), also known as BCWP (Budgeted Cost of Work Performed) | |
Actual Value (AC), also known as ACWP (Actual Cost of Work Performed) | |
SV (Schedule Variance) | |
CV (Cost Variance) | |
EAC (Estimate At Completion) | |
BAC (Budget At Completion) | |
VAC (Variance At Completion) | |
Earned Value Cost Indicators | Planned Value (PV), also known as BCWS (Budgeted Cost of Work Scheduled) |
Earned Value (EV), also known as BCWP (Budgeted Cost of Work Performed) | |
CV (Cost Variance) | |
CV% (Cost Variance Percent) | |
CPI (Cost Performance Index) | |
BAC (Budget At Completion) | |
EAC (Estimate At Completion) | |
VAC (Variance At Completion) | |
TCPI (To Complete Performance Index) | |
Earned Value Schedule Indicators | Planned Value (PV), also known as BCWS (Budgeted Cost of Work Scheduled) |
Earned Value (EV), also known as BCWP (Budgeted Cost of Work Performed) | |
SV (Schedule Variance) | |
SV% (Schedule Variance Percent) | |
SPI (Schedule Performance Index) |
Note
Add one or more earned value fields to other task or resource tables if you want to keep a close eye on one or two calculations without having to apply an entire earned value table. Display the view and table you want and then click the column header where you want the earned value field to be added. Click Insert, Column. In the Field Name box, click the earned value field you want and then click OK.
Measuring earned value helps you see the adherence to the baseline plan or deviation from it, in terms of cost and schedule. But when you review these numbers, what are you actually looking at? Are they good numbers or bad numbers? Or are they just right?
As a general rule, when you see positive numbers in the variance columns of the Earned Value table (that is, the SV, CV, and VAC columns), you’re ahead of schedule or under budget so far. When you see negative numbers in these columns, the task is behind schedule or over budget. When you see $0.00 in the SV, CV, or VAC columns, the associated task is exactly on target with the schedule or budget.
The following list can help you interpret, in a general way, the calculations you see in your Earned Value report. Two names in a field indicates that this one calculation can be referred to by these two different names or initials.
The following list can help you understand how earned value fields are calculated in Microsoft Project and can also help you interpret the data as part of your analysis. A listing with two names indicates that this one calculation can be referred to by either of these two names or initials.
Planned Value (PV) or Budgeted Cost of Work Scheduled (BCWS). The original planned cost of a task, up to the status date. BCWS indicates the amount of budget that should have been spent by now on this task (or for this resource). For example, if a task should be 50 percent finished according to the schedule, the BCWS would be 50 percent of the original planned cost of that task. Microsoft Project determines the values by adding the timephased baseline dates for the task up to the status date. Review this amount in conjunction with the BAC and EAC.
Earned Value (EV) or Budgeted Cost of Work Performed (BCWP). The baseline cost of a task, multiplied by the calculated percentage complete, up to the status date. This reflects the cost of the task work actually done, according to the original budget. BCWP indicates the amount of budget that should have been spent by now on this task (or this resource), based on the amount of actual work reported by this date. If the task is actually 50 percent complete, the BCWP will be the originally planned cost of the work on the task multiplied by 50 percent. Because this is a measure of actual work costs incurred, BCWP is sometimes called the earned value of a task. Compare this amount with the EV/BCWS and AC/ACWP.
Actual Cost (AC) or Actual Cost of Work Performed (ACWP). The sum of all costs actually accrued for a task to date. It includes standard and overtime costs for assigned resources, any per-use costs, cost resources, and fixed costs for tasks. ACWP indicates the amount of budget that should have been spent by now on this task (or this resource), based on the actual work reported by this date. Compare this amount with the EV/BCWS and AC/BCWP.
Cost Variance (CV). The difference between the budgeted costs and the actual costs of a task (BCWP – ACWP). The CV dollar amount indicates the difference between the baseline and actual costs for tasks. A positive CV means that the task is currently under budget. A negative CV means that the task is currently over budget. A CV of $0.00 means that the task is exactly on budget. Compare this figure with SV and VAC.
Schedule Variance (SV). The measure of the difference between the cost as planned and the cost as performed (BCWP – BCWS). Even though it’s called schedule variance, the variance really calculated is the cost resulting from schedule considerations. The SV dollar amount indicates the difference between the baseline costs for scheduled tasks and actual progress reported on those tasks. A positive SV means that the task is ahead of schedule in terms of cost. A negative SV means that the task is behind schedule in terms of cost. An SV of $0.00 means that the task is exactly on schedule in terms of cost. SV does not necessarily indicate whether you’re under or over budget; however, it can be an indicator that budget should be looked at more closely. SV clearly shows how much schedule slippage and duration increases affect cost. Compare this figure with CV and VAC.
Estimate At Completion (EAC). The projected cost of a task at its completion, also known as Forecast At Completion (FAC). EAC is the amount calculated from the ACWP, BCWP, and the Cost Performance Index (CPI), resulting in a composite forecast total of costs for the task upon completion. This dollar amount indicates the current best guess of what this task will cost by the time it’s finished. The projection is based on current schedule performance up to the status date. Compare this amount with the BAC.
Budgeted At Completion (BAC). The baseline cost of a task at its completion. BAC is the cost for the task as planned. BAC is exactly the same as the baseline cost, which includes assigned resource costs and any fixed costs for the task. The budgeted cost is based on the baseline planned schedule performance.
Variance At Completion (VAC). The difference between actual cost at completion and baseline cost at completion, or BAC – EAC. VAC is the cost variance for a completed task. A negative VAC indicates that the forecasted cost for the task is currently over budget. A positive VAC indicates that the forecasted cost for the task is currently under budget. A VAC of $0.00 indicates that the task is right on budget. Compare this figure with SV and CV.
Cost Performance Index (CPI). The ratio of budgeted to actual cost of work performed. CPI is also known as Earned Value for Cost. When the CPI ratio is 1, the cost performance is now exactly as planned, according to current work performance. A ratio greater than 1.0 indicates that you’re under budget; less than 1.0 indicates that you’re over budget. CPI is calculated by dividing BCWP by ACWP.
Schedule Performance Index (SPI). The ratio of budgeted cost of work performed to budgeted cost of work scheduled. SPI, which is also known as Earned Value for Schedule, is often used to estimate the project completion date. When the SPI ratio is 1.0, the task is precisely on schedule. A ratio greater than 1.0 indicates that you’re ahead of schedule; less than 1.0 indicates that you’re behind schedule. SPI is calculated by dividing BCWP by BCWS.
Cost Variance Percent (CV%). The difference between how much a task should have cost and how much it has actually cost to date, displayed in the form of a percentage. CV is calculated as follows: [(BCWP – ACWP)/BCWP] * 100. A positive percentage indicates an underbudget condition, whereas a negative percentage indicates an overbudget condition.
Schedule Variance Percent (SV%). The percentage of how much you are ahead of or behind schedule for a task. SV is calculated as follows: (SV/BCWS) * 100. A positive percentage indicates that you’re currently ahead of schedule, whereas a negative percentage indicates that you’re behind schedule.
To Complete Performance Index (TCPI). The ratio of the work yet to be done on a task to the funds still budgeted to be spent on that task. TCPI is calculated as follows: (BAC – BCWP)/(BAC – ACWP). TCPI helps you estimate whether you will have surplus funds or a shortfall. Values over 1.0 indicate a potential shortfall. Increased performance for remaining work would be needed to stay within budget.
Physical Percent Complete. This is a user-entered value that can be used in place of % Complete when calculating earned value or measuring progress. It represents a judgment that overrides the calculations based on actual duration. To use this option, click Tools, Options and then click Calculation. Click the Earned Value button. In the Default Task Earned Value Method list, click Physical % Complete.
Note
You can see a list of all earned value fields available in Microsoft Project. In the Type A Question For Help box in the upper-right corner of the Microsoft Project window, type fields and then press Enter. Click Earned Value Fields. The list of all available earned value fields appears in a separate Help window.
Click a field name to open a Help topic that gives a description of each field, how it’s calculated, its best uses, and an example of its use.
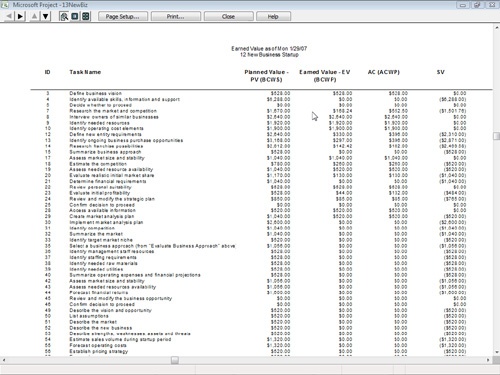
The Earned Value text report is based on the Earned Value table for tasks. Every nonsummary task is listed, along with its earned value calculations for BCWS, BCWP, ACWP, SV, CV, EAC, BAC, and VAC. To run the Earned Value report, follow these steps:
Click Report, Reports.
Double-click Costs.
Double-click Earned Value.
A preview of the Earned Value report appears (see Figure 13-3).
To print the report, click the Print button at the top of the report preview window.
The Earned Value Over Time Report is an Excel visual report that plots a line each for Actual Cost of Work Performed (ACWP or AC), Budgeted Cost of Work Performed (BCWP or planned value), and Budgeted Cost of Work Performed (BCWP or earned value). Based on timephased task data, the lines are plotted over time.
To run the Earned Value Over Time Report, follow these steps:
Click Report, Visual Reports.
On the All tab or the Assignment Usage tab, click Earned Value Over Time Report.
Click View.
Microsoft Project gathers the earned value information from your project and sends it to Microsoft Office Excel 2007. There it plots the information in a line chart for your analysis.