During the execution phase of your project, your resources are working on their tasks, and you’re tracking their progress by entering actuals into your project plan. Those actuals, combined with your baseline information, give you the means to compare your current progress against your original plan. As part of your project control responsibilities, you use this information to keep an eye on project progress. In this way, you can analyze project performance, see how you’re doing, and take any corrective action that you might deem necessary.
As you monitor and analyze project performance day to day, occasionally you’ll need to make adjustments. Perhaps one task finishes a few days early, and this affects its successors and their assigned resources. Maybe another task took longer than expected and went over budget. Suppose that various changes in the schedule caused a resource to become overallocated and another one to be underutilized.
You might need to adjust your project plan to account for such variances. Sometimes, the differences work in your favor, as when a task finishes early. Other times, the differences point to a potential problem, which you can prevent if you catch it soon enough.
The nature of the changes you make to your project plan depends on your project priorities. Remember the one fixed side of your project triangle (finish date, budget/resources, or scope) and adjust your project accordingly.
Note
For more information about the project triangle, see Chapter 9.
In addition to the day-to-day monitoring and adjusting of a project in progress, sometimes larger modifications are needed because of external changes imposed on the project. For example, your customers might announce that you must move the finish date up six weeks. Or a new corporate edict might cut $8,000 from your budget or reduce your staff by 10 percent.
Sometimes, wholesale changes to the project are needed because the scheduled finish date, overall cost, or resource allocation has somehow gotten way off track. In this case, radical measures might be needed to bring the project into conformance again.
With large, externally imposed changes or a temporarily derailed project, you might need to replan or reschedule the project. The techniques used are similar to those you used to hit your targets when you were first planning the project. In your project plan, you make adjustments to the schedule, costs, resources, or scope; and Microsoft Office Project 2007 recalculates your schedule so you can quickly see the results of your replanning.
Whether you’re making large adjustments to respond to large issues or small adjustments to keep a healthy project well on its way, you can always keep a close eye on progress. You can analyze the current status of the project and decide on any corrective actions necessary.
Note
Now that you’re in the execution phase of your project, you might find it convenient to display the Tracking toolbar. It contains many of the tools you need to quickly review and update task status. Click View, Toolbars, Tracking. You can also right-click an empty spot in the toolbars area and then click Tracking.
If you’re managing a time-constrained project, you’ll want to keep a close eye on a few pieces of task information, including the following:
Project finish date
Critical path
Start and finish dates of critical tasks
Current progress of critical tasks
If actuals have changed task scheduling to the point where your target project finish date is projected to be late, you’ll need to adjust the schedule to bring that finish date back in line.
Use one or more of the following techniques to help you monitor progress and make adjustments to achieve your finish date:
Review finish dates and the critical path to see whether you’re still on track, or whether the project is slipping behind.
Check and adjust task constraints, dependencies, and durations as necessary to have the project still finish on time.
Add resources to tasks to shorten the duration of tasks.
Note
For more information about monitoring and adjusting the schedule to achieve a specific finish date, see the section titled Bringing in the Project Finish Date in Chapter 9.
Another method for monitoring schedule progress is to set a baseline and then compare it against the current schedule. For example, you can see baseline finish dates for tasks next to their scheduled finish dates, based on actuals you entered. Then, you can look at the variances between the baseline and scheduled finish. The finish date variance, for example, is calculated as follows:
(Scheduled/Current) Finish – Baseline Finish = Finish Variance
Note
You can use earned value calculations, such as the Schedule Performance Index (SPI) and Schedule Variance (SV) earned value fields, to analyze your project performance so far.
For more information on examining project performance, see Chapter 13.
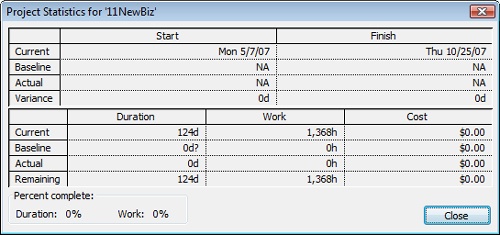
Review your project statistics to get a broad view of how your project status compares with your baseline. Project statistics show your currently scheduled start and finish dates, along with their baseline, actual, and remaining values. To review your project statistics, follow these steps:
Click Project, Project Information.
The Project Information dialog box appears.
Click the Statistics button.
The Project Statistics dialog box appears. The current (scheduled) finish date appears in the Finish column (see Figure 11-1).
Note
You can also use the Tracking toolbar to quickly open the Project Statistics dialog box. On the Tracking toolbar, click Project Statistics.
Another way to keep your eye on the schedule at all times is to add the project summary task row, as follows:
Display the Gantt Chart or other task sheet.
Click Tools, Options and then click the View tab.
Select the Show Project Summary Task check box.
The project summary task appears at the top of any task sheet view, including the Gantt Chart (see Figure 11-2). Task information is rolled up for the entire project, and its summary total is displayed in the project summary row. Specifically, the Finish field in the project summary row shows the latest finish date in the project. If you added additional fields or applied different tables, information is also rolled up for those fields as appropriate.
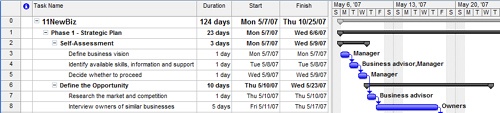
Figure 11-2. The Project Summary row rolls up task information to display the totals for the entire project.
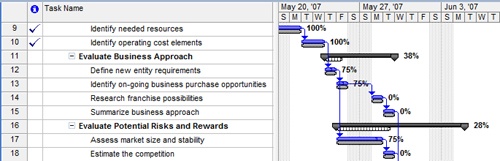
By default, the regular Gantt Chart shows progress as a thin black line through the Gantt bar. To also see percentage complete next to the Gantt bars, apply the Tracking Gantt. Click View, Tracking Gantt (see Figure 11-3).
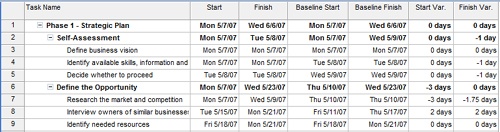
To review the differences between your original baseline plan values and your currently scheduled values, apply the Variance table, as follows:
Display the Gantt Chart or other task sheet.
Click View, Table, Variance.
The Variance table is applied to the current view (see Figure 11-4).
Note
To quickly change to a different table, right-click the Select All box in the upper-left corner of the table in a sheet view. The list of tables appears.
To quickly see the name of the current view and table, position your mouse pointer over the Select All box. A ScreenTip lists the name of the current view and table.
By viewing the finish date or the critical path, you can easily see whether you’re still scheduled to hit your target finish date, given the actuals you’ve entered. To see the critical path, click View, Tracking Gantt. If you need to bring in the finish date, you might want to focus on the critical tasks.
You can filter your task sheet to show only critical tasks by clicking Project, Filtered For, Critical. To show all tasks again, click Project, Filtered For, All Tasks.
Another way to select a filter is to click the Filter tool on the Formatting toolbar. In the Filter list, click Critical. When finished, click All Tasks in the Filter list.
Note
After a critical task is completed, it becomes noncritical because it can no longer affect the completion of future tasks.
Note
For more information about viewing the critical path, see the section titled Viewing the Critical Path in Chapter 9.
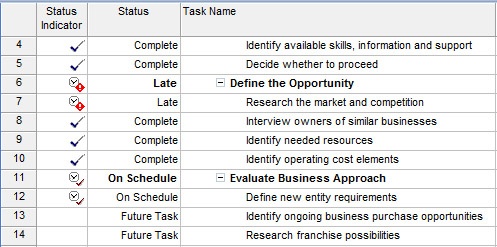
Reviewing the progress of critical tasks is the most effective means of quickly learning whether your project is staying on track to meet its target finish date. The following filters can help you focus on any potential problems with task progress:
Late/Overbudget Tasks Assigned To
Should Start By
Should Start/Finish By
Slipped/Late Progress
Slipping Tasks (see Figure 11-5)
Tasks With Deadlines
Tasks With Fixed Dates
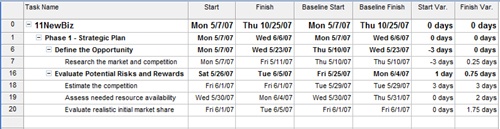
Figure 11-5. Apply the Slipping Tasks filter to quickly see which tasks are in jeopardy (the summary tasks provide context for the tasks).
To apply one of these filters, follow these steps:
Display the Gantt Chart or other task sheet you want to filter.
On the Formatting toolbar, click the arrow in the Filter tool.
In the Filter list, click the filter you want.
When you want to show all tasks again, in the Filter list, click All Tasks.
You can also run text-based and visual reports that provide information about the progress of tasks, such as the following:
Unstarted Tasks
Tasks Starting Soon
Tasks In Progress
Completed Tasks
Should Have Started Tasks
Slipping Tasks
Critical Tasks Status Report (visual report in Microsoft Office Visio 2007)
Task Status Report (visual report in Office Visio 2007)
To run a text-based report, follow these steps:
Click Report, Reports.
Double-click Current Activities.
Double-click the report you want.
If a dialog box appears asking for more information, enter the information and then click OK.
The report appears in a preview window. You can zoom or print the report for a closer look.
To run a visual report, follow these steps:
You can add progress lines to your Gantt Chart that provide a graphic means of seeing whether tasks are ahead of schedule, behind schedule, or exactly on time. Progress lines are shown for tasks that have been completed, are in progress, or are currently due. They are not shown for tasks in the future.
For any given progress date, which you can set as the status date, you can have Microsoft Project draw a progress line connecting in-progress tasks and tasks that should have started (see Figure 11-6). You can set the progress date to be the current date, the project status date, or any other date you select. You can also set multiple progress dates at recurring intervals, for example, on the first Monday of every month.
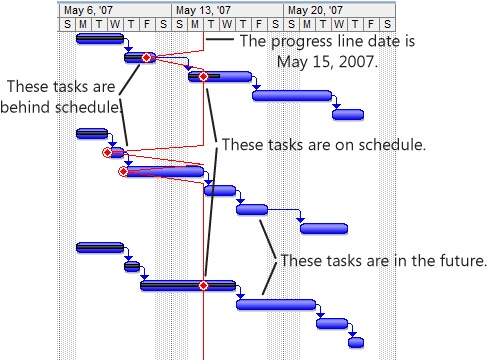
Figure 11-6. The left-pointing peaks indicate a negative schedule variance, whereas straight lines show tasks that are on or ahead of schedule as of the progress line date.
Progress lines create a graph on the Gantt Chart that provides valuable progress information, as follows:
A progress line angled to the left indicates work that’s behind schedule as of the progress line date.
A straight progress line indicates a task on schedule as of the progress line date.
Tasks untouched by the progress line are tasks scheduled to start in the future from the progress line date.
To add a progress line to a Gantt chart:
Display the Gantt Chart, Tracking Gantt, or any other Gantt view.
Click Tools, Tracking, Progress Lines.
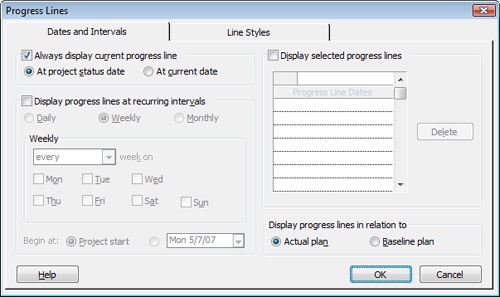
The Progress Lines dialog box appears (see Figure 11-7).
On the Dates And Intervals tab, select the Always Display Current Progress Line check box. Then select whether you want the progress line to be displayed at the project status date or the current date.
The project status date, as well as the current date, is set in the Project Information dialog box (Project, Project Information). If no status date is set there, the current date (today) is used instead.
Under Display Progress Lines In Relation To, select whether you want progress lines to reflect the actual plan or your baseline.
Set any other preferences for the way you want dates and intervals of dates to be represented with your progress lines.
You can enter specific progress line dates, display progress lines at selected date intervals, and so on.
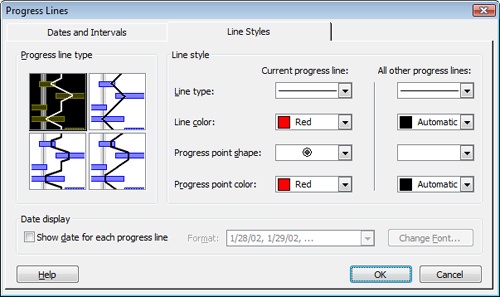
Click the Line Styles tab and set your preferences for how you want the progress lines to appear in the Gantt Chart.
You can specify the line type and color and the progress point shape and color for the current progress line and other progress lines (see Figure 11-8).
Quickly Add a Progress Line
You can use the Tracking toolbar to quickly add a progress line. On the Tracking toolbar, click Add Progress Line. A ScreenTip appears, and the mouse pointer changes to the progress line icon:
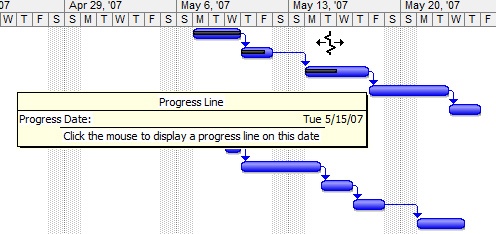
In the chart area of the Gantt Chart, click where you want the progress line to be added. The Progress Line ScreenTip shows the exact date you’re pointing at. The date you click becomes the status date on which the resulting progress line is based.
If you have defined progress line dates in addition to the status date or current date, you can choose to show them only when you want. For example, you might want to show progress lines in a printed view for a status meeting, but hide them while updating progress. To temporarily hide progress lines:
Click Tools, Tracking, Progress Lines.
On the Dates And Intervals tab, clear the Display Selected Progress Lines check box.
The defined progress lines are removed from your Gantt Chart, but the dates remain in the Progress Lines dialog box for when you want to show them again.
You can remove one or more of your defined progress lines. To delete a progress line:
Click Tools, Tracking, Progress Lines.
Make sure the Dates And Intervals tab is showing.
Under Progress Line Dates, select the progress line you want to remove from the Gantt Chart and then click the Delete button.
To hide the current progress line reflecting the project status date or the current date:
Suppose that you reviewed your schedule details and found that your project isn’t going as quickly as planned and the finish date is in jeopardy. Or perhaps upper management has imposed a schedule change, and you need to work toward a different finish date.
If you need to take corrective actions in your project plan to bring in the scheduled finish date, you can do the following:
Check schedule assumptions—such as duration, constraints, and task dependencies—to see whether any adjustments can be made.
Add resources to recover a slipping schedule (this will likely add costs).
Cut scope to recover a slipping schedule (this will probably require stakeholder approval).
Note
For more information about using any of these techniques to adjust the schedule to meet the current or new finish date, see the section titled Bringing in the Project Finish Date in Chapter 9.
When you adjust your project plan to achieve the finish date you need, be sure to check costs, resource allocation, and scope. You need to know how your changes affect other areas of the project plan.
You might also need to set a new baseline, especially if there have been major schedule changes.
Note
For more information on new baselines, see the section titled Need a New Baseline? later in this chapter.