Project 2007 comes with a robust set of fields of several data types. When you double-click a column heading in a task sheet or click Insert, Column, the Column Definition dialog box appears with a few modifiable attributes, such as the title or alignment. However, you cannot change what these built-in fields represent or how they are calculated. If you want to track information that Microsoft Project does not monitor, for example, defect rates during testing, you can create your own custom fields and add them to tables in your views.
Note
For more information about adding fields to tables, see the section titled Using Fields in Chapter 4. For more information about Microsoft Project fields, type fields in the Type A Question For Help box, and then press Enter. Click one of the field types, for example, Duration Fields. A complete list of fields of that type appears in the Help pane.
Microsoft Project provides a set of several custom fields of each data type for tasks and another set of custom fields of each data type for resources. The number of custom fields varies for data type. For example, there are 10 fields for start and finish dates, 20 fields for flags and numbers, and 30 fields for custom text. In addition, there are sets of custom outline codes for both tasks and resources. Microsoft Office Project Professional 2007 provides similar sets of enterprise-level custom codes. With Office Project Professional 2007, you can define project-related custom fields in addition to task and resource fields.
The custom fields in both Project Standard and Project Professional are as follows:
Cost. Cost1 through Cost10 expressed in currency
Date. Date1 through Date10 expressed as a date
Duration. Duration1 through Duration10 expressed as time
Finish. Finish1 through Finish10 expressed as a date
Flag. Flag1 through Flag20 expressed as Yes/No flags
Number. Number1 through Number20 expressed as numeric data
Start. Start1 through Start10 expressed as a date
Text. Text1 through Text30 expressed as alphanumeric text up to 255 characters
Outline Code. Outline Code1 through Outline Code10 (the outline code format is defined by a code mask)
Caution!
Even though the Start and Finish fields appear in the Custom Field list, Microsoft Project uses these fields to store the dates for interim plans. If you intend to save interim plans in your project, don’t use the custom Start and Finish fields. Information in those fields will be overwritten when you save an interim plan. Instead, use custom Date fields for your customized dates.
Custom fields already exist; you can’t introduce new fields into the Microsoft Project database. What you can do is modify the valid values for custom fields or specify how their values are calculated. You can control how their summary values are determined. If you don’t want to display the values for a custom field, you can substitute graphical indicators.
Note
See the section titled Working with Outline Codes later in this chapter to learn how to create outline codes.
Follow these steps to customize a field of any type other than outline code:
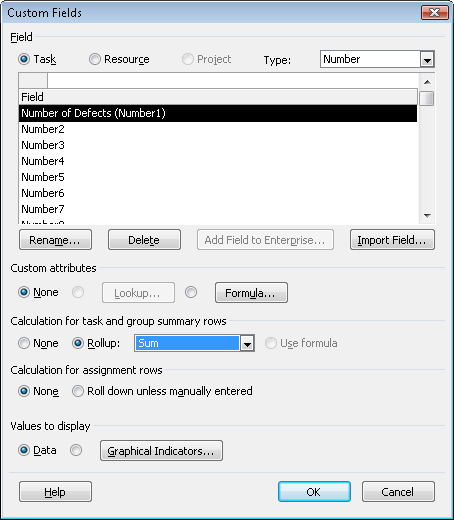
Click Tools, Customize, Fields.
The Custom Fields dialog box appears (see Figure 25-14).
Select the Task or Resource option to specify whether this will be a task or resource field.
In the Type box, choose the type of custom field you want to customize.
Note
In Project 2003, outline codes had a separate tab in the Custom Fields dialog box. You clicked the Custom Fields tab to access all other types of fields, but clicked the Custom Outline Codes tab to customize outline codes. In Project 2007, the tabs are gone and instead, you choose the custom field data type in the Type box.
With custom fields, you can control the values that they accept, as well as whether those values are identified in a list of valid values or calculated by a formula. If you do not specify values in some way, the custom field accepts any entry as long as it meets the requirements for the data type, for example, a Number field accepts numbers, not text or dates.
Some custom fields are easy to fill in—Start, Finish, Date, Flag, and Cost are self-explanatory. However, for text, number, and outlice code fields, leaving the choice of values to the people who type in data could lead to gibberish. By setting up a list of values for people to choose from, called a lookup table, you can help them enter the right values. And, if valid values are specific, you can set up a custom field to accept only the valid values you specify. You can identify a lookup table for any custom field except for a Yes/No field.
To specify a list of values that appears in a custom field list, do the following:
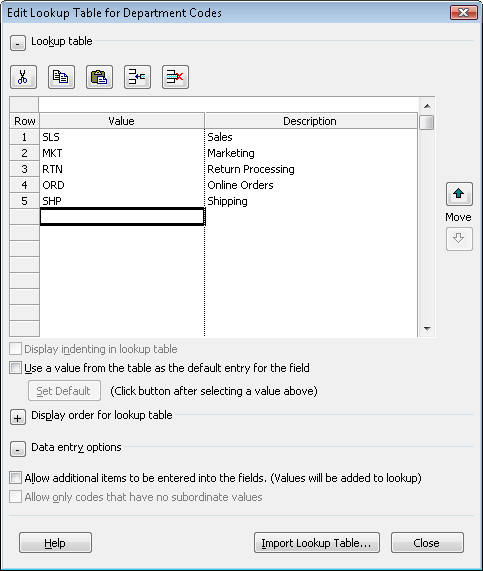
In the Custom Fields dialog box, click Lookup. (In Project 2003, the button label was Value List.)
The Edit Lookup Table dialog box appears (see Figure 25-15).
Click a blank cell in the Value column and then type the value. In the Description cell in the same row, add a description of what the value represents.
For example, if you use a custom text field to store department abbreviations, the Description field can hold the full department name. When you display the drop-down list of values in a task sheet, the value and its description appear in the list.
To specify one of the values as the default, select the Use A Value From The Table As The Default Entry For The Field check box. Click the cell that contains the default value and then click Set Default.
The default value appears bolded and in blue.
To order the values, click the plus sign to the left of the Display Order For Lookup Table label. The By Row Number option displays the values in the order you enter them in the list. You can also sort the values in ascending or descending order.
If you choose the Sort Ascending or Sort Descending options, click Sort to rearrange the rows.
Note
If another custom field (in the current project or another project) contains a lookup table with the entries you want, click Import Lookup Table. If the lookup table resides in another project, open the project file. Then, in the Import Lookup Table dialog box, click the project that contains the lookup table, select the option for the type of field (Task, Resource, or Project), and then click the name of the custom field that contains the lookup table.
To allow users to enter values not in the lookup table, click the plus sign to the left of the Data Entry Options label and select the Allow Additional Items To Be Entered Into The Fields check box.
In Project 2007, this check box is cleared by default so that the lookup table values are the only valid values unless you say otherwise. If you allow other entries in the custom field, Microsoft Project adds those values automatically to the lookup table.
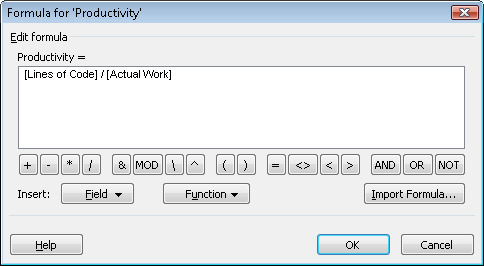
Using formulas, you can set up a custom field to calculate its value with functions and other fields in the Microsoft Project database. For example, you might set up a field to show productivity by dividing the number of actual hours spent by the number of lines of code written (stored in another custom field).
To define a formula for a calculated field, follow these steps:
In the Custom Fields dialog box, click the Formula option.
A message box appears telling you that any data in the field will be discarded because the formula will determine the field values. If the field is empty or contains data you don’t care about, click OK to continue. To keep the data in the field, click Cancel and then choose a different field to customize.
Click the Formula button.
The Formula dialog box appears and displays the custom field name followed by an equal sign above the Edit Formula box.
To add a field to the formula, click Field, point to the field category, and then click the field you want to add (see Figure 25-16).
To add a function to the formula, click one of the function buttons. Alternatively, click Function, point to the function category, and then click the function you want to add.
To type a value in the formula, click the location in the formula where you want to insert the value and then type the text or number.
To direct the order that functions execute, insert parentheses in the formula.
By default, Microsoft Project does not calculate values for custom fields for summary tasks or for the rows containing rolled-up values for groups. However, if you want some type of calculation for summary tasks and group summary rows, you can choose the type of calculation or use the formula you defined for the field. To use the same formula that you defined for the custom field, under Calculation For Task And Group Summary Rows in the Custom Fields dialog box, select the Use Formula option.
If you select the Rollup option, you can choose from several built-in calculations in the Rollup drop-down list, including the following:
Average. The average of all nonsummary values underneath the summary task or group
Average First Sublevel. The average of all the values of tasks one level below
Maximum. The largest value of all nonsummary values
Minimum. The smallest value for all nonsummary values
Sum. The sum of all nonsummary values underneath the summary task or group
When you work with a custom number field, the following calculations also appear when you select the Rollup option:
Count All. The number of summary and nonsummary tasks one level below the summary task or group
Count First Sublevel. The number of nonsummary and summary tasks one level below the summary task or group
Count Nonsummaries. The number of nonsummary tasks below the summary task or group
In Microsoft Office Project 2007, you can now control how values in a task custom field are distributed to the assignments within the task. For example, if you set up a number field, you can apportion the value to each assignment. Click the Roll Down Unless Manually Entered option to apportion the contents of the custom field to assignments. Microsoft Project divides the value across assignments unless you manually enter values into the custom field in an assignment row. Click the None option if you do not want to distribute the contents of the custom field to assignments.
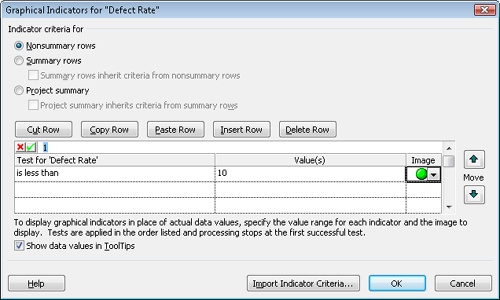
Graphical indicators in place of custom field values can make values easier to interpret. At the same time, if you want your audience to see status without the actual results, you can use graphical indicators to hide the actual numeric values. For example, you might want to display a green light when a task is ahead of schedule, a yellow light when a task is slightly behind schedule, and a red light when a task is more than 2 weeks late.
To display graphical indicators instead of values, follow these steps:
Open the Custom Fields dialog box and choose the custom field to which you want to apply graphical indicators.
Under Values To Display, select the Graphical Indicators option and then click the Graphical Indicators button.
The Graphical Indicators dialog box appears.
To assign graphical indicators to nonsummary rows, select the Nonsummary Rows option.
Note
By default, summary rows and the project summary row both inherit the same conditions that you specify for nonsummary rows. If you want to use different conditions for summary rows, select the Summary Rows option and then clear the Summary Rows Inherit Criteria From Nonsummary Rows check box. Define the tests and indicators for summary rows as you would for nonsummary rows. To specify different conditions for the project summary row, select the Project Summary option and then clear the Project Summary Inherits Criteria From Summary Rows check box. Define the tests and indicators for the project summary row.
In the table, click the first empty cell in the Test column, click the down arrow, and then click the test you want to apply for an indicator, for example, Equals or Is Less Than.
Enter the value for the test in the Value(s) cell.
You can enter a number or other string, or you can select a field whose contents become the comparison value.
For example, to display an indicator when a custom number field has a negative value, click Is Less Than in the list in the Test cell and then type 0 in the Value(s) cell. To display an indicator when a custom date field is greater than the baseline finish, click Is Greater Than in the Test cell and then click [Baseline Finish] in the Value(s) field.
Click the Image cell, click the down arrow, and then click the graphical indicator to display when the condition is true (see Figure 25-17).
To define graphical indicators when other conditions are true, repeat steps 4–6 in the next blank row in the table.