You might have a specialized report requirement that none of the built-in text or visual reports fulfills. The following sections describe how to create a new text report and a new visual report from scratch.
When you create a new text report, you start with a report template that gives you the framework within which to build a good report. There are four text report templates, or report types:
Task
Resource
Crosstab
Monthly Calendar
If you’ve edited or copied any existing text reports, or just looked at a report’s definition out of curiosity, you’re probably already familiar with at least some of these report types. They’re also the basis for all the built-in text reports. You can preview any of these report formats. In the Custom Reports dialog box, select its name and click Preview.
To build a custom report, follow these steps:
Click Report, Reports.
In the Reports dialog box, double-click Custom.
In the Custom Reports dialog box, click New.
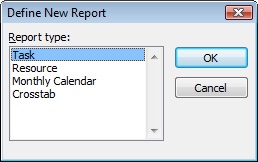
The Define New Report dialog box appears (see Figure 12-30).
In the Report Type box, select the type of report you’re creating and then click OK.
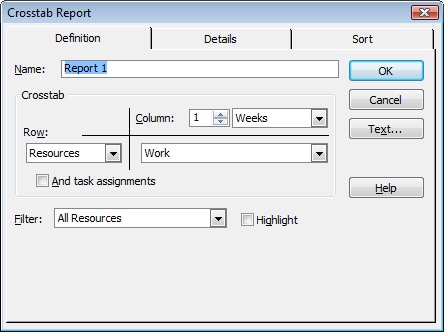
The report definition dialog box appears. The dialog box you see depends on the report type you select (see Figure 12-31).
In the Name box, enter the name of your new custom report.
Make sure that it’s a unique name in the Reports list.
Define your report. Specify any fields, filters, or formatting as the report definition.
If you’re defining a task, resource, or crosstab report, also use the Details tab to specify additional information you want to add to the report. Use the Sort tab to specify which field should dictate the order of information in the report.
Make any changes you want to the report fonts by clicking the Text button.
In the Item To Change box, click the report element whose text you want to format and then specify the changes you want. When finished, click OK.
When finished with your new report’s definition and changes, click OK in the report definition dialog box.
The name of your new report appears in the Reports list in the Custom Reports dialog box.
Select your new report if necessary and then click Preview to generate the report and see what it looks like.
If you want to make further changes, click the Close button in the Preview window and then click Edit.
The report definition dialog box appears again.
Your new report is saved with your project file and is available whenever you work in this particular project.
When you create a new visual report, you specify the data type, or OLAP cube, such as Task Usage or Assignment Summary. This provides the basis for the visual report, whether it’s to be generated in Excel or Visio.
To create a visual report template from scratch, do the following:
Click Report, Visual Reports.
Click New Template.
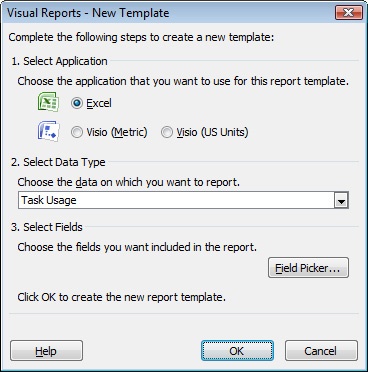
The Visual Reports – New Template dialog box appears (see Figure 12-32).
Under Select Application, select Excel if you want to create an Excel chart from Microsoft Project data. Select one of the Visio options if you want to create a flow diagram from Microsoft Project data.
Under Select Data Type, choose the type of data you want to use as the basis for your report.
Visual reports are based on six different sets of information: Task Summary, Task Usage, Resource Summary, Resource Usage, Assignment Summary, and Assignment Usage. These data types determine the fields that Microsoft Project adds to the OLAP cube, but you can add or remove fields as well.
To modify the fields to be used in the template, click Field Picker and add or remove fields in the Available Fields list.
To add fields to the new visual report’s OLAP cube, select the fields you want from the Available Fields list. Then click Add.
To remove fields from the Selected Fields list, select the fields and then click Remove.
Click OK in the Visual Reports – Field Picker dialog box and then click OK in the Visual Reports – New Template dialog box.
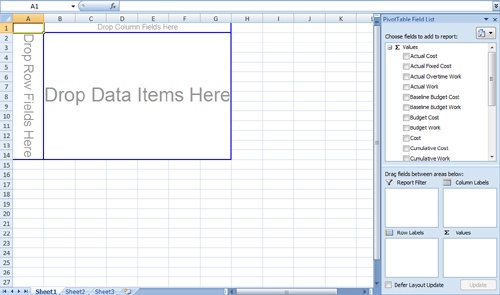
For an Excel template, Excel launches and opens a blank PivotChart (see Figure 12-33).
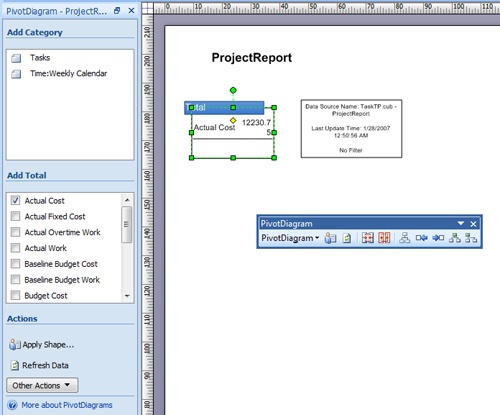
For a Visio template, Visio launches and opens a blank PivotDiagram (see Figure 12-34).
Note
For details on building a new PivotTable in Excel for a Microsoft Project visual report, see the section titled Creating and Editing Visual Report Templates in Excel in Chapter 17. For details on building a new PivotDiagram in Visio for a Microsoft Project visual report, see the section titled Creating and Editing Visual Report Templates in Visio in Chapter 19.
When you have configured the PivotTable or PivotDiagram, save the template. In the Save As dialog box, make sure that the template is being saved to the folder where all the other templates are located, for example, the Documents and SettingsuserApplication DataMicrosoftTemplates folder.
Saving the template in this folder ensures that the template will appear in the Visual Reports – Create Reports dialog box.
If you save the template in a location other than the default Microsoft templates folder, you can still have it included in the list of visual reports. On the Visual Reports – Create Report dialog box, click the Include Report Templates From check box, click the Modify button, and then browse to the location of your new template. Select the template and then click OK.