
So far, we have looked at all the tabs in Quiz except for the Results tab. Without useful and well-organized reporting tools, we can't make effective inferences about the abilities or knowledge of the test taker. Moodle Quiz has a variety of built-in ways to review quiz results.
The first thing we need to do is click on the Results tab, located between the Info and the Preview tabs. Once we click on this tab, we will see four options: Overview, Regrade, Manual Grading, and Item Analysis with Overview being selected.
This feature gives us a lot of information about the test and the test taker. The first information we see is the number of attempts that have been made on the test. For our test, we will see two attempts on the test, one from each of the sample students I created. The second piece of information we see is the number of attempts allowed. For our quiz, this shows a message stating, Only one attempt per user allowed on this quiz.
The next information we see here is in the form of a table that includes the student name; when the test was started and finished; the time it took the student to complete the test; the student's grade; which questions were correct or incorrect; the feedback they received based on the score; and, in the case of multiple attempts, information about each. At the bottom of the chart, we are given the Overall average score for the test and the average points received for each question, rounded up. Here is an example of how the chart of two students having attempted the test appears:
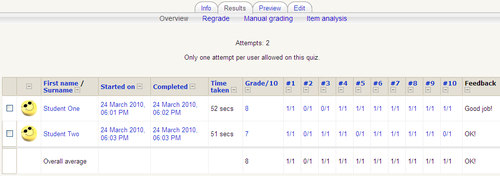
The information contained here is very useful to us. We are shown, quite clearly, many of the important details about the student's performance on the test, including final or total grade.
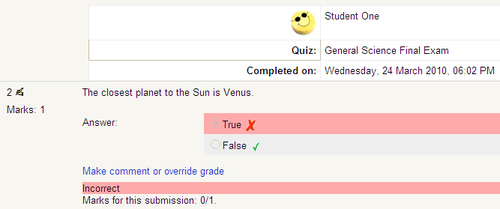
The score under Grade/10 is a link. If we click on this link, we will be taken to the student's test where we will be able to see all the information detailed in the chart, the correct, partially correct, and incorrect responses, and the Feedback for each individual item. In addition, we are given the option to comment or override the grade for each item in the test.
To make a comment or override the grade, we simply need to click on the Make Comment or Override grade link and we will be shown a pop-up menu. The pop-up menu will have the question name, a comment textbox, a grade textbox, and a Save button. To make a comment, simply enter what you want to say into the Comment area and click on Save. Once you have done this, the comment will appear in the related question, just above the correct or partially correct or incorrect message. If you want to alter the grade, simply enter the grade you want in the Grade textbox and click on Save. This action will change the grade on all pages.
Looking back at the previous chart, we can see that #2 was the only item that both students got wrong, and this is something we can look at later to decide if we created a question that was misleading, something we didn't fully cover in our course, or something simply too difficult for our students.
Now, if we were using a standard test, with item shuffling turned off, we would know that they both got the same question wrong. But wait, we are using a test with the shuffle feature turned off! Yes, that's true; however, we are using random questions. This means that while they both got the item that was presented second, wrong, chances are they were not the same question. If we click on the 0/1 under #2 for Student One, we will be shown which question they were presented with. In the case of Student One , we will be presented with the following screenshot:
In the case of Student Two, it appears in the same way, except for the True/False statement is not The closest planet to the Sun is Venus but One of Saturn's moons is Ganymede. If you decide to use the Shuffle Questions feature or the Random Questions, as we just learned, it is important to remember that, while the numerical order is the same, the items are most likely different.
Looking back at the previous chart, you can see a checkbox next to the student names. We can use these checkboxes to delete the student attempt, or multiple attempts if multiple attempts were allowed. For example, if we want to have a student retake the test, we might simply want to delete their original attempt instead of allowing multiple attempts for everyone. There might also have been a problem during the test and you want all the students to retake it. To delete an Attempt, simply click on the student or students whose tests you want to delete and click on the Delete selected attempts button at the bottom of the chart. There is an option that allows you to Select/Deselect all.
To export the student data for printing, further analysis, or file keeping, Moodle Quiz offers three methods: Download in ODS Format, Download in Excel Format, and Download to text format. ODS means Open Document Spreadsheet format and this option will export the files as .ods. Excel Format will export the data as .xls. Text format will export the data in a plain text format. All files are encoded in UTF-8, which is important to note, especially if you are working in a non-English language.
To export the files, you click the format button of your choice and you will get a message asking how to save or open the file. Make your selection and the file will be placed where you selected. All the data will be set out as it is in the chart, titled and organized in the same manner and order. Note that you can use the backup option and select only the quiz if you want to backup the data. You can then always import it when you need it. Also, the data stored in XML format is quite accessible with the right tools.
Below the downloading options, we see the preferences we can set to display the page and the data from the Quiz reports. There are two preferences we can adjust: how we Show/download the student data and the report view, as shown in the next screenshot:
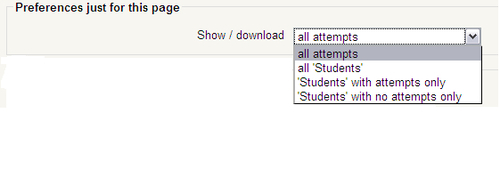
The previous image shows the four options we have for how we will display and download the report. Our options allow us to choose display all the attempts made on the test, all the students enrolled in the course (whether they have attempted the test or not), all the students that have attempted the test, and all the students who have not attempted it. This setting can be extremely useful, although its usefulness depends on your needs and what you intend to do with the data. Another option is to show/download only the attempts that were graded. In the case of multiple attempts, you can also set this option to display the highest grade received.
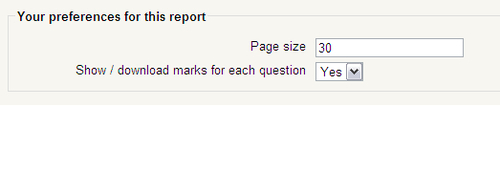
The second option we have related to preferences is Your preferences for this report, as seen in the next screenshot. The two options here are Page size and Show/download marks for each question. The Page size will alter the number of student results seen on the report. If it were set to '1', we would see one student's test results on each page. This option can be useful if you are interested in speaking to students about their grades and showing them their results on screen without them being able to see anyone else's. It can also be useful if you want to focus on individuals instead of groups.
The second option, Show/download marks from each question drop-down menu offers a simple Yes or No option. If you select Yes, you will see each item and the score the student received on it. If you select No, you will not see the report as shown previously, and a message saying Nothing to display will be seen in its place.
Once you have decided how you would like the page displayed or downloaded, press the Save preferences button directly below the Your preferences for this report.
You also have the option to hide columns in the table by clicking on the minus sign in the column headers. This is particularly useful for users with small screens or Moodle installations with fixed width interfaces, for example, 960px.
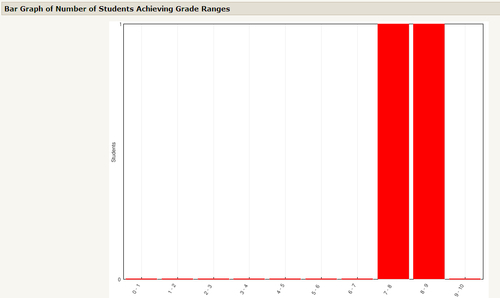
The only remaining item on the page is the Bar Graph of Number of Students Achieving Grade Ranges. This chart gives us a visual representation of how the students performed on the test. We can't manipulate it, but it is a useful tool for a quick overview of how the students scored overall. While it would clearly be more useful if we had more results, here is what it looks like with our two students shown. We can see that one student scored in the 7-8 range and the other student scored in the 8-9 range.
When you have your students grouped and set the Group mode to visible, the chart will show how many members scored in each band.
Regrade is used if you have decided to alter the grade for a question or test, or if you have changed a question. To use this feature, click on the Regrade tab at the top of the screen and the scores will be recalculated. There is nothing else you need to do.
If there has been a change made in any score, a link will be supplied that will bring you to the item that was changed so you can review it. Do not let this function make you think that you don't have to closely review the quiz before using it!
This feature is used for items that can't be automatically graded by Quiz, such as Essay type questions. If you click on Manual Grading and there are no items that require manual grade entry, you will get a message saying that there is nothing to grade. This process is different from regrading or overriding a grade. If you do have an item that requires a manually entered score, you will see the output as shown in the next screenshot:
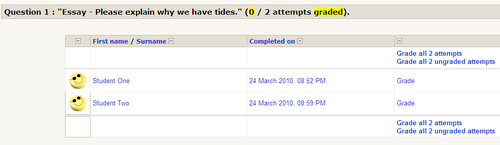
As you can see, I have created an Essay question for our students asking them to explain why there are tides. You can also see that neither of the essays has been graded yet. We have the options to do three things here.
First, we can grade each response individually by clicking on the Grade link in the student's row. If we click on this link, we will be brought to a page with the question, the student's response, a comment box for us to give feedback to the student, and a grade box where we will put our score for the item. Once we comment and give a score, we click on the Save changes button located in the bottom left-hand side corner of the window. The screenshot is as follows:
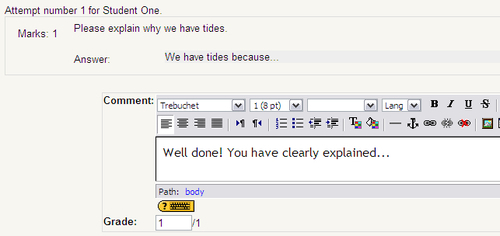
Once we have clicked on the Save changes button, the score and comments will be reflected in the test grade and we will see, in the Manual Grading link under the Edit tab, that the grade has been recorded. The student will be able to see the feedback, depending on which Review options you chose to use. Now we can go on to the next student.
This horizontal grading is very convenient, especially when you give the mark scheme as the general question feedback and here only add a comment when you think it is necessary to explain how you applied that mark scheme. You can also paste the mark scheme in the comment and, for instance, make the text of the mark scheme red where the student has missed marks. I find that teachers want to start giving their quizzes in Moodle when I show them how quickly I grade essay questions.
The second option, Grade All # Attempts opens all the essays submitted in a single page. This option allows us to go through and quickly read, comment, and score student essays without having to constantly open and close questions. The only drawback here is that should something go wrong, such as your session timing out or dropping your Internet connection, you will lose all your work. Therefore, it is a good idea to save your work occasionally to limit the risks of data loss.
The third option, Grade All '#' Ungraded Attempts works in a similar fashion except it opens only those responses that have not been scored.
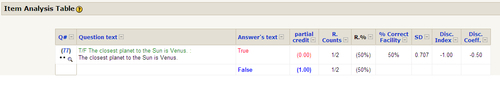
This is an extremely useful feature for teachers and researchers. Selecting this feature will open a page containing a list of the questions and how all the students answered each one. An example of what it looks like is shown in the next screenshot:
As we can see from the previous screenshot, there is a lot of information available to use here. I've broken them down to make it easy to understand. The screen will become more cluttered when using different question types, so it is a good idea to hide the columns you don't need to view by using the minus sign next to the column headers.
This narrow column contains several useful pieces of information. First, the number in parentheses is the Question ID number. Clicking on this ID Number will open an Edit Question pop-up window, which will allow us to look over the question or make any changes desired.
Below the number, we can see the item type; here it is True/False. Next to the item type, we see the Preview icon, which will show us exactly how the question should appear to the students while taking the test.
Clicking on the Q# will sort the IDs in ascending order, and clicking on it again will sort them in descending order.
This column gives us the name of the question and the question text. This option can clutter the screen if you have a long question text.
This column shows us the possible answers. With Essay type questions, this column shows the student answer. The correct answer is highlighted in bold blue text. The incorrect response is in a normal red text.
This column shows how many of the students responded, using the answer in the Answer's text. The number here is given as R/S (total number of responses/total number of student attempts).
This column takes the numbers from the R. Counts column and calculates them as a percentage. Basically, it indicates the percentage of students that chose that particular answer.
This column is a measure that indicates the difficulty of the question. This difficulty level is calculated by taking the total number of correct responses and dividing by the total possible points. In cases of True/False type questions, the number represented here will be the same as the number of students who answered correctly.
SD stands for Standard Deviation. Standard Deviation is the average distance to the average. This function shows us the numerical spread in responses to the question. If all students respond correctly, the SD will be 0.000. The larger the number, the larger the variation in responses.
Disc. Index stands for Discrimination Index. This feature is used to evaluate the quality of the question itself. To do this, an average of all the scores for the question is taken. Then the group of test takers is divided into thirds: top scores, middle scores, bottom scores. The Disc. Index then takes the Top Scores Group and subtracts them from the Bottom Scores Group, then it divides the number by the average. The results will be somewhere in the range of 1.0 to -1.0. 1.0 to 0.0 indicates that the question is 'good'. If the number of the Disc. Index goes below 0.0, it indicates that the question was answered correctly more often by the lower-scoring students. This result may indicate a problem with the question and it should be reviewed and altered if necessary.
Disc.Coeff. stands for Discrimination Coefficient. This calculation is another way to look at the differences between high and low scores and their relationships to the answers of individual students. This function will determine the correlation coefficient between the question being analyzed and the entire test. The only real difference in the Disc. Coeff. and the Disc. Index, is that in the Disc. Index only the top and bottom third of the scores are used, but in the Disc. Coeff. all the scores are used.
At the bottom of the page, we see three ways to manipulate the way the data is presented. The Analysis options section is seen in the next screenshot:
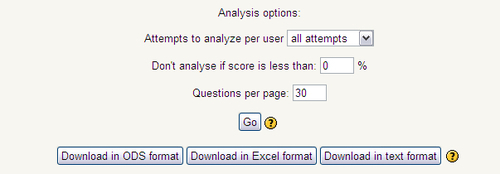
Remember, if any changes are made to the default settings, make sure to click on the Go button to save the changes and refresh the review page. The first and second fields also affect what is exported.
This drop-down menu offers four options for how we will look at each student's attempts. The first option is all attempts, and this will show us all the attempts a student made on the test. The second option is Highest grade, which will only display the highest-scored attempt for us to review. The third option is First attempt, and this will simply display the student's first try. The final option is Last attempt, which will display the student's final effort.
The default setting here is All, which will affect the measures. You will probably want to select one of the other options if a quiz has been offered with multiple attempts.
This option will eliminate any test from review if the score is below a certain threshold. This option can be useful under certain conditions. To use this feature, simply enter a number in the textbox and any test that does not exceed the percentage will not be reviewed.