
To access Gradebook, you need to go to the Administration section and click on the Grades link. It is located on the left side of the screen and looks like this:
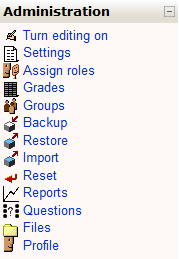
As you can see, Grades is the fourth option from the top, between Assign roles and Groups.
Once you have clicked on this link, you will be taken to the Gradebook and what is known as the Grader report. Note that this is the Teacher View.
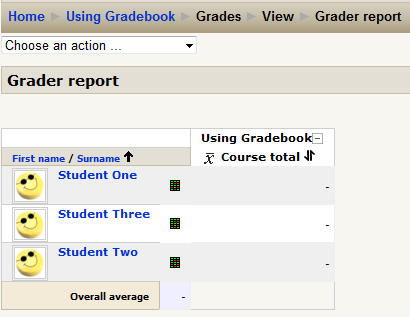
As you can see, we have enrolled our three imaginary students. We can also see that there is no grade for any of them yet, since we have not created any Grade Items. We will do this shortly. First, I'd like you to look at the Choose an action drop-down menu located directly under the Home | Using Gradebook breadcrumbs. This drop-down menu has all the possible actions we can take in the Gradebook, and I'd like to take a few pages to discuss all the options available here.
View is the first section visible in the drop-down menu. As you can see here, there are three options available, Grader report, Overview report, and User report.
The Grader report is what we were just looking at. It contains the list of students in the leftmost column and a row of assignments listed just above the names. This will display all the student scores, for all assignments, in all categories. We will see a full example of this later, once we have added some assignments and categories.
This is a very useful view for teachers because it allows you to look at trends in the grades across assignments and classes. The only drawback to this view is that it can get long and you can lose sight of which student's grades you are reviewing. There is an Expand/Collapse function available next to the course name just above the assignments. When the grades are in the expanded view, there will be a + visible. Clicking on this sign again will change the view to the collapsed view and leave a minus sign - visible, which when clicked will revert the page to the expanded view. The expanded view is shown in the next screenshot:
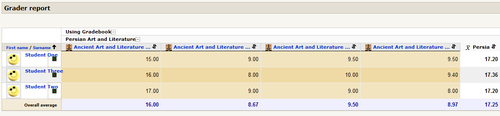
Another useful feature of this page is the averaging feature. Each Assignment column will be totaled and averaged at the bottom. For instructors this can be a very valuable tool because, not only is the calculation done for you, but it enables you to see any major changes in performance, which could indicate a particularly easy or difficult assignment, or issues with the preparation, instructions, or grading.
The last column is titled Course total. This column totals all the student assignment grades and gives the student's current score in the course. At the bottom of this column, you can see the course average grade. This can be extremely useful to determine where students fall in the course and can help you quickly determine which students may need additional assistance or student-teacher conferences.
Tip
Missing Grades
There are several reasons why you might not see a student's grade. They might not have completed the assignment, it may not have been graded yet, or it could be something else. If you see missing grades in the Gradebook, the first thing you want to do is look at the assignment that has no grade to find out where the problem lies. If the assignment isn't there, then talk to the student about it.
The Overview report allows you to look at all the courses the student is enrolled in and see his/her grades in each. It also allows the student to see his/her grades in all the courses. You, and the students, are able to access the Overview report from any course enrolled in. The report itself creates a list. This is shown in the next screenshot:
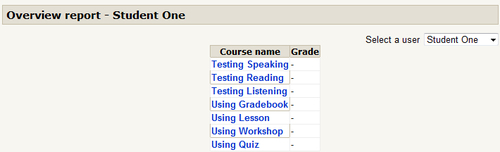
As you can see here, our student, Student One, is enrolled in seven courses. The student has received no grades in any course as of yet.
Also, on the far right, you can see a drop-down called Select a user. This drop-down lists all the students, and you select which student you want to view here. We will see another example of this later, once we have given the grades.
The User report view provides much more detailed information about assignment grades than the Grader report. It also breaks down the view to a single individual. Selecting this view will bring you to a new page with a list of course assignments, quizzes, and so on, listed in their categories. The categories are nested in color, making it easy to see how the grades are organized and how the final calculation is broken down. The report is a very useful way to look at student grade information. An example is shown in the next screenshot:
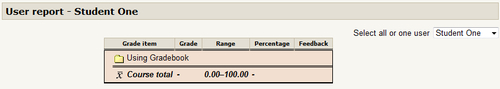
In the upper left-hand side, we can see the name of the user we are working with. On the right-hand side of the screen, we can see a drop-down with the title Select all or one user. Clicking on the drop-down will enable the instructor to select the student's grades he/she wants to look over. The instructor also has the option to select all users, which will show the user reports of all the members in the course listed in an alphabetical order.
The report itself holds five columns of information about the student's grades.
The Grade item is the assignment name. It is important to create clear and meaningful assignment names because when reviewing the user or grader reports, assignments named 'H1', '12', and so on, don't allow for quick recall or recognition of the task the students were assigned. This reduces the value of the reports.
Grade is, obviously, the grade the student has been given for the assignment. It is shown as a total number of points received from the assignment. This number is calculated out to two decimal places.
At the very bottom of this column, we see a point-based grade based on the total number of assignments, the assignment's weight, and the assignment's point value. If you have not used categories, and all assignments are worth equal weight, this number will be the same as the percentage score.
The Range column shows the possible range of scores available for the given assignment. For example, a test with a maximum possible value of 20 would show '0.00 20.00' in the Range column.
At the bottom of the Range column, you will see a range. The numbers in the range will be based on the lowest and highest numbers available in grading. For example, if we had ranges of '0.00 5.00', '0.00 20.00', and '0.00 100.00' the range displayed at the bottom would be '0.00 100.0'.
You might remember that I mentioned only three reports earlier. There are, in fact, four reports; however, the Outcomes report is not initially visible in the drop-down menu. The Outcomes report is used to track student achievement and to see if they have reached certain course goals or standards. These can be very useful in courses if you need to determine whether or not a student has reached the minimum acceptable level of competence in the course.
First enable the Outcomes feature. You must have administrative access to do this, so if you don't, ask your site administrator to do it. To enable the Outcomes you need to go to Site Administration | Grades | General settings.
Go to General settings:
- Click on the Enable outcomes feature, located one down from the top of the list.
- Once you have enabled this, save the changes and return to your course.
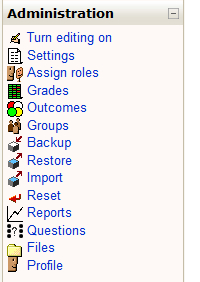
- Once you are back in your course, you will notice a change has been made in the Administration block.
Between the Grades and Groups, you will see a new link called Outcomes. The updated block is shown in the next screenshot:
Once you have done this, to get to the Outcomes report, you just go back to the drop-down menu and the Outcomes report will be there. The Outcomes report is shown in the next screenshot:
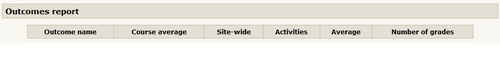
This column shows whether or not an outcome is used only in the course or if it is a Site-wide outcome.
Now that we understand how outcomes will be displayed, we will look at how to create them. When we create Outcomes, we can make either course-based or site-wide ones. We will look at creating course-based Outcomes first, then we will look at site-wide Outcomes.
To create course-based outcomes, we need to click on the Outcomes link in the course administration block. This will open a page displaying two columns. On the left-hand side are the Outcomes already associated with the course. On the right-hand side are any outcomes you are able to add. Since we have not created any outcomes in our course yet, we will not see anything here right now. This is shown in the next screenshot:
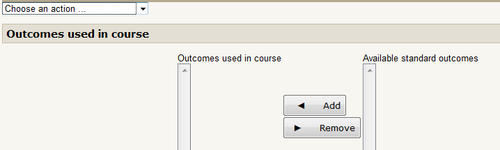
Since we have nothing here, we need to go to the Choose an action drop-down and scroll down to the new Outcomes section. You will see two options, Outcomes used in This course and Available standard outcomes. If we click on Edit Outcomes, we will be taken to the Outcomes page, as shown in the next screenshot.
Here we have two options, we can either import Outcomes from other courses as .csv files or we can create a new one. Since we have no Outcomes to import, we will create a new one. To do this we will click on the Add a new outcome button. Once we click on the button, we come to the Add an outcome page, as shown in the next screenshot:
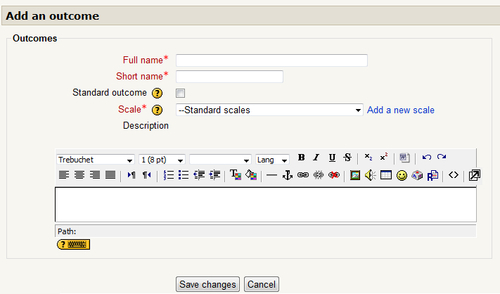
This is where you can select the type of grading scale to use with the Outcome. Until you add scales, the only visible option will be Separate and connected ways of knowing, which we have looked at before. If you want to create a new scale to be used for the outcome, click on the Add a new scale link, which will open a new window where you can create your own scale. Clicking on the button will bring you to the Add a new scale page, which we will look at in a moment.
By clicking on the Add a new scale link, you will be taken to a new page where you can create a new grading scale. This is shown in the next screenshot:

This is the name of the scale and it will be listed in the Scale drop-down menu. You should make it something from which you, and anyone else on the site, will be able to quickly and easily identify how it will be used.
This is where you enter the scale you want to use. Each option you include should be separated with a comma from the following one. In addition, your scale should start from the lowest possible option and move to the highest possible one. For example, if want to create a list of five words describing your evaluation of the student's work, it might look like this: Unacceptable, Poor, Fair, Good, Excellent.
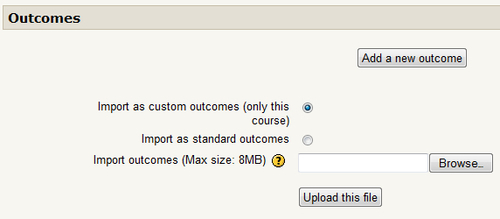
Standard Outcomes are used to enable site-wide outcome scales; however, only administrators can do this. If you have administrative access, you can go to the Site Administration block and click on Grades. Once in Grades, click on Outcomes.
On this page you will be able to do two things. The first option is to Add a new Outcome, which works just as mentioned earlier. The second option is to Import Outcomes. We have not looked at importing or exporting Outcomes, but this can be done.
We will add a new scale here, giving it a Full name and Short name, and for scale, we will use the Quality of Work Scale we used earlier. After we give it a description, we press the Save changes button. Once this is done, the Standard Outcomes page is shown as in the next screenshot:
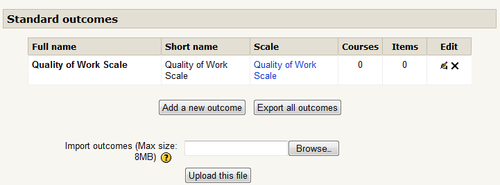
As shown in the previous screenshot, we can see the Full name and Short name given, the type of scale being used, and how many courses and items are using the new scale. In the Edit column, we have the option to either edit the Outcome or completely delete it.
Right now our Courses and Items columns are empty because we have not added this to any yet. If we go to a course we are teaching in, and click on the Outcomes link now, we will see the Quality of Work Scale is visible on the Outcomes used in course page in the available Standard outcomes. If we highlight the new scale and click on the Add a new outcome button, it will be moved to the Outcomes used in this course column, which will make it available for use in nearly all activities.
You are able to import and export Outcomes for use in other courses, sites, or to make them available to others.
Exporting the information is simple. As you can see from the previous image, there is an Export all outcomes button. Clicking on this button will allow you to save the file as a .csv file, which can be opened with a spreadsheet program like Excel or a text editor. The default naming for this is outcomes.csv.
Once it is exported, you will be able to open and view the file, make changes if you want, or give the file to other teachers who may want to review the scale, or upload it to their own sites.
If you have been given a .csv file containing all the appropriate information, you can import it to your site. Click on the Browse button and locate the appropriate file, then press the Upload this file button and the Outcomes will be added to the course.
If you are interested in creating your own .csv Outcome files to import to a course or site, see http://docs.moodle.org/en/outcomes for additional information.
Once you have created the new scales for your assignments, you can begin to use them. The first thing you will want to do is create the activity. In the activity settings, the newly created scale will be available for use. We will use an Offline activity to show how this is done.
First, we go through and add all the information necessary for the activity. In the Grade drop-down, we will see the new scale we created earlier. Simply select that option and the new scale will be how we assess the assignment.
Once we have received the student's work, we review it and in the assignment's Grade drop-down, we will see our Outcome choices available for use.
The number of items added to the scale will determine the score the students receive. For example, in our created scale, an Excellent would be worth 100 percent, or five points since we entered five items, and an Unacceptable would be worth 0 percent, or zero points.
Outcomes can be a very useful tool for assessing your students and can help make them aware of their performance in the course and in specific assignments.
The next area we will look at is the Categories and Items section of the Gradebook. Under this heading, there are two options, Simple View and Full View. This is where we are able to create categories and add individual items for assessment. The Simple View is shown in the next screenshot:
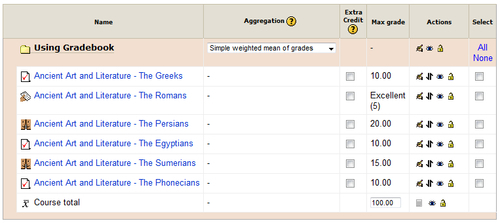
This is the name of the course, category, or item that is part of the student's grade in the course.
This is where you decide how the grade calculations will be done. By choosing different Aggregation strategies, you are able to determine how each item and category will be calculated to arrive at the students' final score. There are nine choices available in the Aggregation drop-down, so there are many options in how you can calculate the student's score. The options available are: Mean of grades, Weighted mean, Simple weighted mean, Mean of grades (with Extra credits), Median of grades, Smallest grade, Highest grade, Mode of grades, and Sum of grades.
We have looked at the Aggregation methods before, so please refer back to the explanation if you need to refresh your memory.
This column is used if any of the assignments has been given an extra credit value. If it is to be used as extra credit, check the box in the column to signify this.
Several detailed examples of how extra credit is calculated into the overall score are given on the Moodle.org site.
The Max grade setting shows what the maximum score possible for the assignment is.
Tip
Grades over 100 percent
If you want to give a grade over 100 percent, you can. You need to get whoever your administrator is to go to the Administration | Grades | General settings area of the site. At the very bottom of the page, there is a setting called Unlimited Grades. By default it is set to No, but by turning this on, you will be able to enter in any score you would like, 105 percent, 121 percent, and so on.
The full view offers a far more detailed view of how the grades will be calculated. Here is our previous example put into the Full view mode.
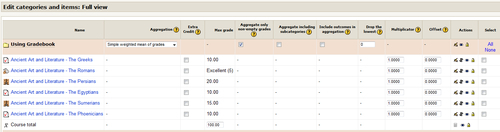
The Name, Aggregations, Extra Credit, Max grade, Actions, and Select columns are identical to the Simple view. Here, we will look at the six new features visible.
This setting is used to determine whether or not assignments without grades are included in the overall course grade. By default, this is turned on and any assignments without a grade are not included in the Course total. If the setting is turned off, ungraded work will be included in the final grade.
This option is mainly used to include the subcategories in the category you are working with. However, you do have the option to include every subcategory while excluding any aggregated grades.
If you include all Outcomes in your grading, your grade results might be different than you want. For example, the score associated with an Outcome could be very different than scores for other assignments. Using this setting, you have the option to exclude Outcomes from the aggregation.
If this setting is used, the lowest grade or grades will be dropped from the overall calculations. The number of lowest grades dropped is determined by the number you enter into the textbox.