If you already have a project schedule built in Microsoft Project, the main reason to view that data in Visio is to present your project information more effectively. You can transfer all tasks in a project or only top-level tasks, summary tasks, milestones, or any combination of these. Then, you can use the shapes and formatting tools in Visio to highlight crucial information. Although Visio includes four templates for schedule-oriented information, only the Timeline and Gantt Chart templates include wizards for displaying the Microsoft Project data you export in Visio diagrams.
If you want to summarize project timeline information, for example, to show project phases and key milestones, you can display schedule information that you build in Microsoft Project in a Visio Timeline diagram. You don’t have to export information from Microsoft Project. Instead, with the Import Timeline Data Wizard in Visio, you can select the tasks you want from a Microsoft Project file and display them as tasks and events along a horizontal or vertical bar in Visio.
To display Microsoft Project information in a Visio timeline, follow these steps:
Make sure that the Microsoft Project file that you want to present is not open in Microsoft Project.
In Visio, create a new Timeline drawing or open an existing one.
Choose Timeline, Import Timeline Data.
On the first wizard screen, click Browse. Navigate to the Microsoft Project file that you want to display in Visio. Select the file and then click Open. Click Next to proceed to the next wizard screen.
On the Select Task Types To Include screen, select the type of tasks you want to display in Visio and then click Next.
By default, All is selected, which is perfect if you want to build a timeline of the entire project. For presentations, especially to upper management stakeholders who need a high-level view, you might choose Top Level Tasks And Milestones.
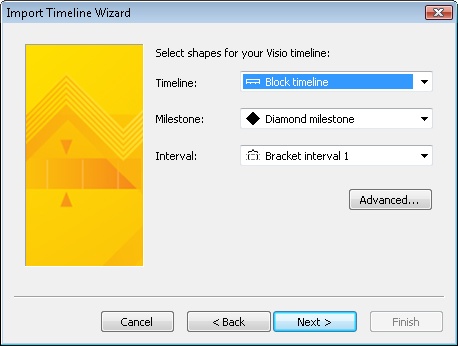
On the Select Shapes For Your Visio Timeline screen, select the shapes you want to use on the timeline if they differ from the ones selected by default (see Figure 19-8). Click Next.
The wizard transfers the overall project schedule information into a Timeline shape. Milestones in your Microsoft Project schedule (and any tasks with a duration of zero) become Visio Milestone shapes. Summary tasks in your project schedule become Interval shapes.
On the final wizard page, review the import properties you selected. If you decide to change any of the properties, click Back until you get to the appropriate screen.
When the import properties are set the way you want, click Finish.
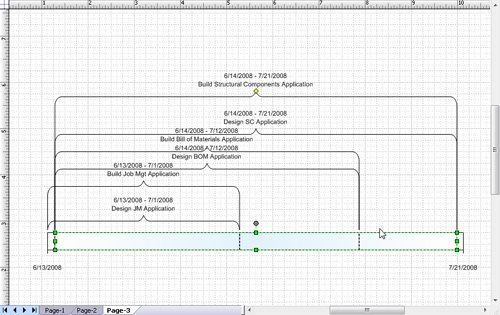
Visio transfers the information from the selected Microsoft Project tasks (see Figure 19-9) into Visio shapes. If you opened an existing Timeline drawing, Visio creates the new timeline on a new page.
If you display summary tasks and the intervals or their annotations overlap, select a shape and drag its yellow control handle to reposition the label.
To change the shape for a task, right-click it and then click Set Timeline Type, Set Interval Type, or Set Milestone Type on the shortcut menu.
To configure other aspects of a shape, right-click it and choose a command from the shortcut menu, such as Set Percent Complete or Change Date/Time Formats.
To display Microsoft Project data in a Visio Gantt Chart, follow these steps:
In Visio, choose File, New, Schedule, Gantt Chart.
In the Gantt Chart Options dialog box, click OK to close the dialog box. You can configure the Gantt Chart after you import the tasks from Microsoft Project.
You can also import Microsoft Project data into an existing Gantt Chart drawing.
In the Visio menu bar, choose Gantt Chart, Import.
The Import Project Data Wizard launches.
On the I Want To Create My Project Schedule From screen, select Information That’s Already Stored In A File and then click Next.
On the Select The Format Of Your Project Data screen, select Microsoft Office Project File and then click Next.
On the Select The File Containing Existing Project Schedule Data screen, click Browse, navigate to the directory that contains the file you want to import, select the file, and click Open. Click Next.
On the Time Scale screen, specify the major and minor timescale units, as well as the time units you want to use for duration. Click Next.
On the Select Task Types To Include screen, select the type of tasks (All, Top Level Tasks Only, Milestones Only, Summary Tasks Only, or Top Level Tasks And Milestones) you want to import from Microsoft Project to Visio. Click Next.
On the final wizard screen, review the import properties you selected.
To change any properties, click Back until you get to the appropriate screen.
When the import properties are set the way you want, click Finish.
The selected tasks import into tasks in a Gantt Chart in Visio. If you import into an existing drawing, Visio creates a new page for the imported chart.
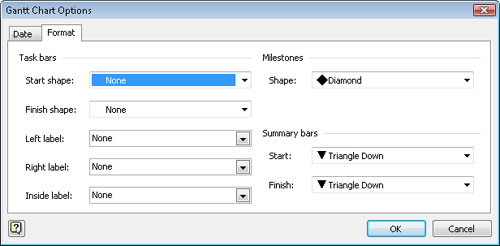
To configure the chart, click Gantt Chart, Options (see Figure 19-10), which opens the Gantt Chart Options dialog box.
You can specify the start and finish dates for the timescale, the units to use for duration, and the time units for the timescale. On the Format tab, you can specify the shapes for task bars, summary bars, and milestones, as well as the text that appears as labels on the bars.