Many of the processes and structures reflected in your project plan can be represented in a graphical format and illustrated to help others better visualize them. In Microsoft Office Project 2007, you are already using a Gantt Chart and Network Diagram to depict your project plan. By using the Microsoft Office Visio 2007 diagramming software, you can create more extensive visual representations of the flows, concepts, structure, and organization involved with your project. The unique capabilities of Office Visio 2007 make it a great tool to use in conjunction with Office Project 2007.
As a project management tool, Microsoft Project represents your project by calculating task dates, establishing resource usage, and maintaining a database of the thousands of pieces of data that make up your project plan and keep it moving along. As a diagramming tool, Visio can take information you select from your project plan and represent it in an easy-to-understand graphic that can clearly communicate project information to wider audiences.
With Microsoft Office Project 2007, your favorite integration between Microsoft Project and Visio is likely to be the new visual reports feature. Choose a visual report, and Microsoft Project transfers the appropriate data to a Visio template, ready for viewing. The Visio templates include commands for configuring which results you see, which is indispensible when stakeholders question you about different aspects of project performance.
In addition to visual reports, you’ll find other reasons to transfer data between Microsoft Project and Visio. Sometimes, the easiest way to summarize project status or highlight problem areas is to export key project information to a Visio timeline or Gantt chart. If the copy of Microsoft Project that you requested for your birthday hasn’t arrived, you can start building projects using the Visio Timeline, Gantt Chart, and PERT Chart templates. When you switch to Microsoft Project, you can export your Visio timelines and Gantt charts and start up in Microsoft Project where you left off in Visio.
You can exchange information between Microsoft Office Project 2007 and Visio in several ways:
Use a visual report in Microsoft Project to analyze data with a Visio PivotDiagram. Each visual report specifies the data to transfer for the report and the Visio PivotDiagram template to use to communicate project information. By swapping which fields you use to summarize or total results, Visio PivotDiagrams are perfect when you want to be ready to answer any questions that arise.
Import a Microsoft Project file to a Visio timeline or Gantt chart. Importing a Microsoft Project file into Visio is helpful when you want to take advantage of the presentation features in Visio to present project highlights.
Import a Visio timeline or Gantt chart into a Microsoft Project file. You might not use this method as frequently as you transfer in the other direction, but it’s ideal when you want to bring an initial task list into Microsoft Project for full-blown project management.
New in Microsoft Office Project 2007, visual reports use Microsoft OfficeVisio Professional 2007 or Microsoft Office Excel 2003 or later to transform Microsoft Project data into easy-to-understand charts and graphs. Microsoft Project 2007 comes with numerous built-in report templates for communicating task, resource, and assignments information.
A visual report assembles the data it needs and stores that data in a database. Then, it applies a Visio (or Office Excel 2003 or later) template to the data to generate the report in a Visio PivotDiagram (or Excel PivotChart). Once you generate the visual report, you can configure the report using Visio or Excel pivot tools to examine different fields over different time periods—without generating a brand new report. For example, you might begin by analyzing cost flow for each fiscal quarter and then, when cash flow is tight, expand the report to view cash flow by week.
If necessary, you can modify any of the many existing visual reports or create your own report templates to do exactly what you want. You can add, remove, or rearrange the fields you want to analyze. In addition, you can publish your customized visual reports for team members or other project managers to use.
Note
For more information about creating a visual report in Excel, see the section titled Producing a Visual Report of Project Data in Excel in Chapter 17.
Visual reports for Visio transfer data to a Visio PivotDiagram for analysis. For example, the Task Status report shows how much money has been spent and the percentage complete for the entire project. You can configure the report to analyze tasks at every layer of the work breakdown structure.
Note
For more information about using the traditional Microsoft Project text-based reports, see the section titled Working with Text-Based Reports in Chapter 12.
To generate a built-in visual report for Visio, do the following:
In Microsoft Project, click Reports, Visual Reports.
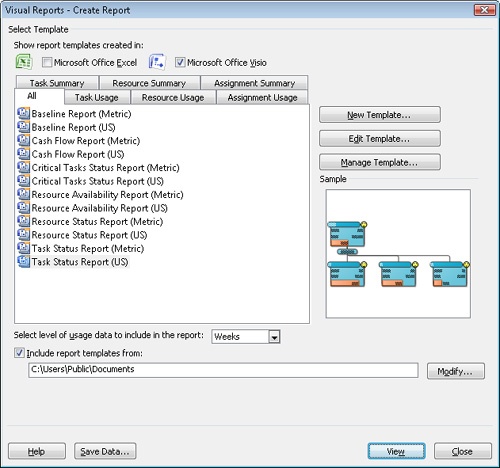
To view visual reports that use Visio, clear the Microsoft Office Excel check box and be sure to select the Microsoft Office Visio check box (see Figure 19-1).
To view all the visual reports that come with Microsoft Project, regardless of the category to which they belong, click the All tab.
Using the All tab is the easiest way to find the reports you want, unless you have created many of your own custom visual report templates. To see only the reports in a specific category, select the tab for that category. For example, the Task Usage category includes the Cash Flow Report template, whereas the Assignment Usage category includes templates for reporting baseline and budgeted costs.
To specify the level of detail that Microsoft Project transfers to Visio, click a time period (Days, Weeks, Months, Quarters, or Years) in the Select Level Of Usage Data To Include In The Report box.
Although any time period can work with any project, Days or Weeks are better for shorter project, whereas Months or longer periods provide faster reporting for longer projects.
If you want to save an OLAP (Online Analytical Processing) cube of the data for the report, click Save Data.
Saving an OLAP cube makes generating additional reports faster, because the step of gathering and transferring data is already complete and saved in the OLAP cube.
To generate the report, click View.
Visio launches and creates a PivotDiagram that uses the OLAP cube of data transferred from Microsoft Project (see Figure 19-2).
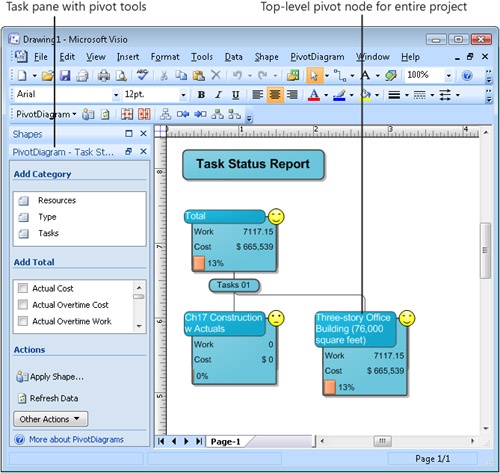
When a visual report first opens in Visio, the most detail you see is a box with data for the entire project (see Figure 19-2 in the previous section). The tools you need to view the data by different categories or with various calculations are all in the Visio PivotDiagram task pane. For example, you can change the category to view results by tasks, resources, or time periods, and you can add different total (such as work or cost) or group nodes in different ways.
To modify a visual report to show different results, use any of the following methods:
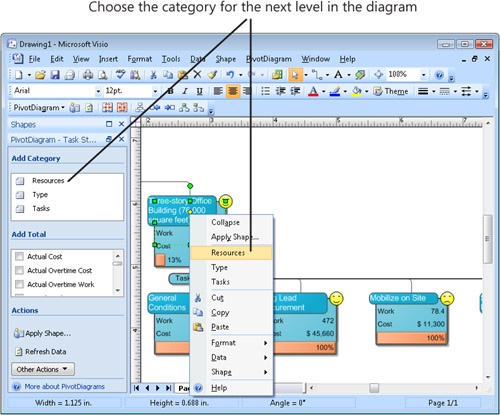
Use a category to expand a node in the diagram. Right-click the node and then click the category you want for the next level on the shortcut menu (see Figure 19-3). You can also click the category you want in the PivotDiagram task pane.
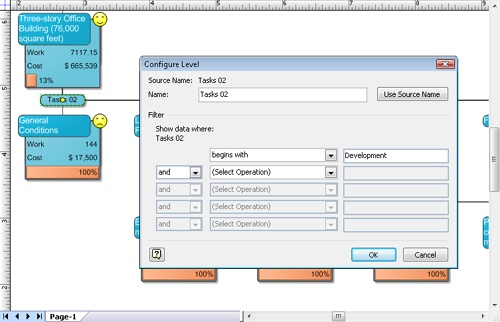
Filter the data that appears at a level. By default, a level in a PivotDiagram includes all the data in the OLAP cube. If you want to display information for only some parts of the project, right-click the Pivot Breakdown shape for that level (the small box that contains the category name, such as Tasks 02, shown in Figure 19-4) and click Configure Level on the shortcut menu. In the Configure Level dialog box (shown in Figure 19-4) in the Filter section, specify tests and values to filter the data.
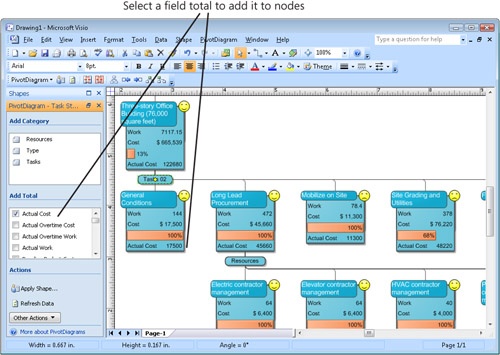
Show different totals in nodes. The nodes for a visual report contain specific totals by default, but you can include other totals as well. In the PivotDiagram task pane, in the Add Total section, select the check boxes for the fields you want to total (see Figure 19-5).
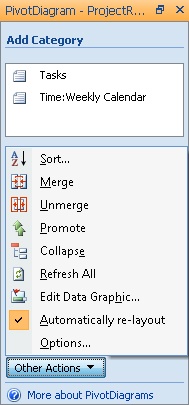
Combine nodes in different ways. For example, to add the tasks for two summary tasks together, in the PivotDiagram task pane, click Other Actions and then click a command, such as Merge, Promote, or Collapse (see Figure 19-6).
The built-in visual report templates cover many aspects of project performance, from baselines and cash flow to resource availability and task status. If none of the built-in reports do exactly what you want, you can edit a template to fit your requirements. You can even create a new custom visual report template from scratch, which involves only a few more steps than editing a built-in template.
When you choose a visual report template, you are in effect specifying the fields you want to work with and the type of data on which you want to report. Because Visio visual reports use PivotDiagrams, you can use pivot features to further fine-tune the report after it’s built in Visio.
To edit a built-in visual report template, do the following:
Click Reports, Visual Reports.
Select the built-in visual report template you want to edit and then click Edit Template.
The Visual Reports Field Picker dialog box appears.
To add fields to the OLAP cube for the visual report, in the Available Fields list, select the fields you want and then click Add.
The fields appear in the Selected Fields list. Remove fields from the Selected Fields list by selecting the ones you want to remove and then clicking Remove. You can select multiple fields to add or remove by holding the Ctrl key and clicking the fields you want to select.
Click the Edit Template button.
Microsoft Project builds the OLAP cube based on the fields you selected and launches Visio with the built-in Visio template for the selected report.
Make the changes you want to the settings in Visio and then save the Visio template.
To create your own template, do the following:
Click Reports, Visual Reports.
Click New Template.
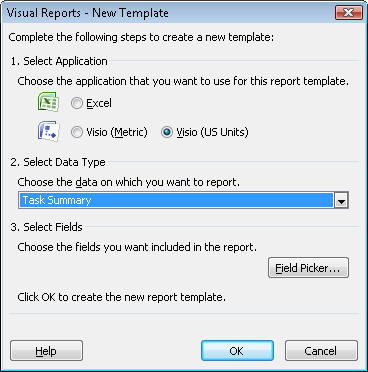
The Visual Reports - New Template dialog box appears with the three basic selections you must make to build a template (see Figure 19-7).
To create a Visio-based report, select either the Visio (Metric) or Visio (US Units) option.
Under Select Data Type, choose the type of data you want to use as the basis for your report.
Visual reports are based on six different sets of information: Task Summary, Task Usage, Resource Summary, Resource Usage, Assignment Summary, and Assignment Usage. These data types determine the fields that Microsoft Project adds to the OLAP cube, such as resource-related fields for resource reports. You can add or remove fields as well.
To modify the fields for the template, click Field Picker.
You can add or remove fields for the template just as you would for a built-in template, as described earlier in this chapter.
Click OK.
Visio launches and opens a PivotDiagram with a node for the entire project, and it sets up a few categories.
Configure the diagram using the techniques described in the section titled Configuring a Visual Report in Visio earlier in this chapter.
When the PivotDiagram looks the way you want, on the File menu, click Save. In the Save As dialog box, navigate to the folder in which you want to save the template, enter a name for the template, and click Save.
To see your custom templates in the Visual Reports dialog box list, select the Include Reports Template From check box and click Modify to specify the path that contains your custom templates.