In a perfect world, you’d define the project scope, schedule tasks, assign resources, and presto! The project plan would be finished and ready to execute.
In reality, however, this is rarely the case. After you’ve scheduled tasks and assigned resources, you generally need to check the results and see whether they meet expectations and requirements. Ultimately, you might need to answer one or all of the following questions to your satisfaction and to the satisfaction of your managing stakeholders:
Will the project be finished on time?
Is the project keeping to its budget?
Do the resources have the appropriate amount of work?
If you get the wrong answers to any of these questions, you need to adjust your project plan until you get the right answers. For example, if the finish date is too far away, you can add more resources to major tasks.
After you make such adjustments, you need to check the project plan again. Adding resources to tasks might bring in the finish date, but it also might add cost if you have to hire additional resources or authorize overtime. And if you assign more tasks to existing resources, those resources might be overallocated.
To save time as well as money, you might decide to cut certain tasks, a deliverable, or a phase. But if this means you’re cutting project scope, you probably need to get approval from your managing stakeholders.
This relationship between time, money, and scope is sometimes referred to as the project triangle (see Figure 9-1). Changing one side of the triangle affects at least one of the other sides of the triangle.

You need to know which side of the triangle is your largest priority. Is it schedule—you definitely have to finish by October 26? Is it budget—there is absolutely $264,300 for this project, and not a penny more? Is it scope—it is imperative that each and every task in your project plan be implemented? Only one side of the triangle can be "absolute." The other two sides must be flexible so you can adjust the project plan to hit that one absolute.
Depending on which side of your project triangle is your absolute, you might adjust your project plan to do one of the following:
Although not strictly a part of your project triangle, it’s likely that you also will check resource workloads. Resources are the biggest part of your project costs. If any resources are overallocated, you might be facing more overtime than your budget will allow. If resources are grossly overallocated, you run the risk that the tasks won’t be done on time and the entire project will slip. If any resources are underallocated, you might be paying more for resources than you should, which also affects your budget.
After you make your adjustments and balance your project triangle to meet the project requirements, you’ll be ready for stakeholder buyoff. After you have buyoff, you’ll be ready to start the execution phase of the project.
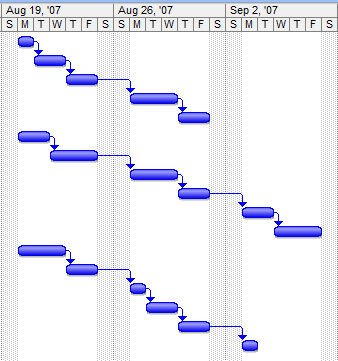
Most projects have multiple sets of tasks, which have task relationships with one another, taking place at any one time. In an office move project, for example, the facilities manager and her team might be researching new office sites and then working out the lease terms. At the same time, the office manager and his team might be ordering new office furniture and equipment and then arranging for movers. These two sets of activities are not dependent on each other and use different sets of resources. Therefore, they can be scheduled on parallel tracks (see Figure 9-2). The project can have any number of sets of tasks on these parallel tracks, or paths, depending on the size and complexity of the project, as well as the number of resources involved.
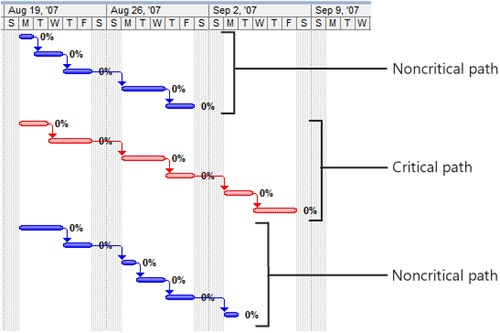
At any time, one task has the latest finish date in the project. This task, along with its predecessors, dictates the finish date of the project as a whole. The finish date of this path is critical to the finish date of the project itself; therefore, we call it the critical path. In turn, the tasks that make up each step along the critical path are called the critical tasks (see Figure 9-3). Because the critical path dictates the finish date of the project, we pay a tremendous amount of attention to it in project management.
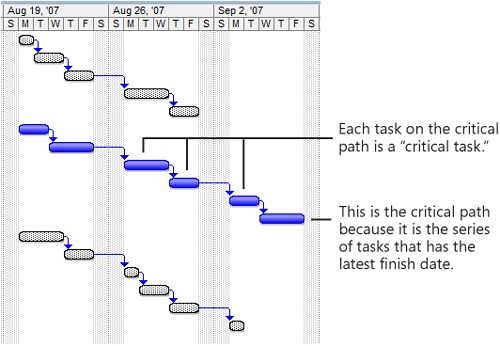
Figure 9-3. The finish date of the last task on the critical path dictates the finish date of the entire project.
Note
The term critical task refers only to tasks that are on the critical path. These terms reflect the scheduling of the tasks, not their relative importance. There can be very important tasks that don’t happen to be on the critical path.
In the planning phase, you identify a particular critical path. After you begin the execution phase and actual progress begins to be reported, the critical path might change from one set of linked tasks to another. For example, task progress is likely to differ in various ways from the original schedule. Perhaps one task in the critical path finishes early, but a task in a second path is delayed. In this case, the second path might become the critical path if that is now the path with the latest finish date in the project.
If you need to bring in the finish date, one of the most effective things you can do is focus on the critical path. If you can make critical tasks along that path finish sooner, you can make the project itself finish sooner.
Note
For more information about strategies to bring in a project’s finish date, see the section titled Bringing in the Project Finish Date later in this chapter.
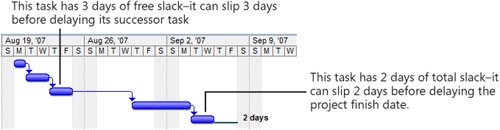
Many tasks have some amount of scheduling buffer—an amount of time that a task can slip before it causes a delay in the schedule. This scheduling buffer is called slack, or float. The following describes the two types of slack:
Free slack is the amount of time a task can slip before it delays another task, typically its successor task.
Total slack is the amount of time a task can slip before it delays the project finish date (see Figure 9-4).
Because critical tasks cannot slip without delaying the project finish date, critical tasks have no slack, and tasks with no slack are critical.
If a noncritical task consumes its slack time, it usually causes its successor to use some or all of its total slack time. The previously noncritical task becomes a critical task and causes its successor tasks to become critical as well.
Negative Slack Situations
Sometimes you run into a situation in which you have negative slack; that is, the opposite of slack time. Negative slack can occur in a task with a finish-to-start task dependency when a successor task is due to begin before the predecessor is finished. This can happen when the task duration of a predecessor task conflicts with a successor task that must begin on a date specified by an assigned constraint, for example (see Figure 9-5).

Figure 9-5. In this example, the indicated task has negative slack because although it has a finish-to-start task dependency, its successor is scheduled to begin before the task is finished. As a result, all the task’s predecessors also have negative slack.
Negative slack is a problem because it has tasks bunching up on each other, essentially indicating that to maintain the schedule, a task needs to start before it should. That is, the task has to be scheduled to start before the conditions of its task dependencies are fulfilled.
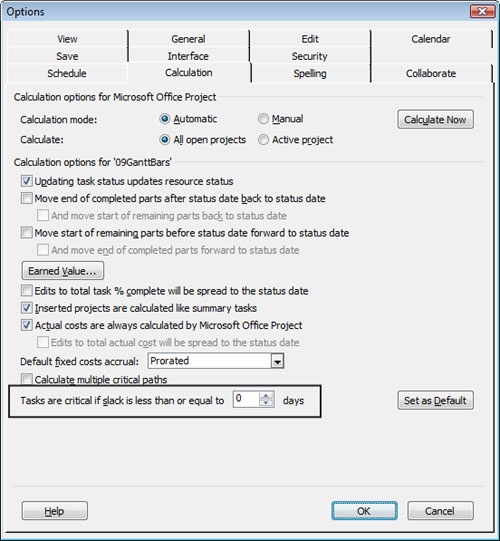
Maybe you don’t want just those tasks with total slack of 0 to be critical. For example, perhaps you want your critical tasks to be those that still have 1 day of slack. In this case, you can change the definition of a critical task. To do this:
Click Tools, Options and then click the Calculation tab.
Near the bottom of the tab, enter your preference for a critical task in the Tasks Are Critical If Slack Is Less Than Or Equal To box (see Figure 9-6).
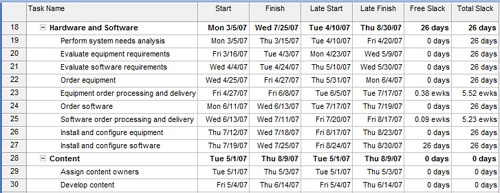
To see how much free slack and total slack each task has, you can apply the Schedule table to a task sheet, as follows:
Click View, Gantt Chart. Or display any other task sheet you want.
Click View, Table, Schedule.
The Schedule table is applied (see Figure 9-7). You might need to drag the vertical divider to the right to see some of the columns in this table.
The easiest way to see the critical path in a Gantt chart is to click View, Tracking Gantt. The Tracking Gantt highlights the critical path in red in the chart portion of the view (see Figure 9-8). The Entry table is applied by default to the Tracking Gantt, just as in the regular Gantt Chart.
Note
When you first open a Gantt chart, the timescale is at today’s date. If the tasks you’re reviewing are in the past or future, you might not see the Gantt bars in the chart. Click a task whose Gantt bar you want to see. On the Standard toolbar, click Go To Selected Task.
You can also use the Gantt Chart Wizard, which formats the chart portion of any Gantt Chart view to highlight the critical path. To do this, follow these steps:
Click View, Gantt Chart.
If you want to modify another Gantt chart view, such as the Leveling Gantt or Tracking Gantt, display that view instead.
On the Formatting toolbar, click Gantt Chart Wizard.
On the first page of the Gantt Chart Wizard, click Next.
On the second page, select the Critical Path option (see Figure 9-9). Then click Next.
On the third page, select the option for any text you want to accompany the Gantt bars, such as resource names, dates, and so on. Click Next.
On the fourth page, select whether you want the link lines for task dependencies to show. Click Next.
On the final page, click the Format It button.
Office Project 2007 formats your Gantt chart according to your specifications.
Click the Exit Wizard button to view your new Gantt chart format, which displays red Gantt bars for critical tasks.

Although displaying the Detail Gantt or using the Gantt Chart Wizard can display the Gantt bars for the critical path at a glance, you can also look at the details for individual critical tasks. The following list details different methods for viewing critical tasks:
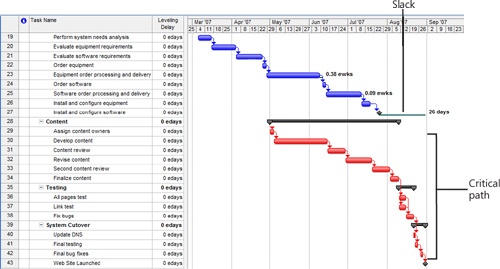
Display the Detail Gantt. Click View, More Views, Detail Gantt. This view shows the critical path tasks in red Gantt bars (see Figure 9-10). By default, the Delay table is applied to the sheet portion of the view.
Review the Critical Tasks report. Click Report, Reports. Double-click Overview and then double-click Critical Tasks.
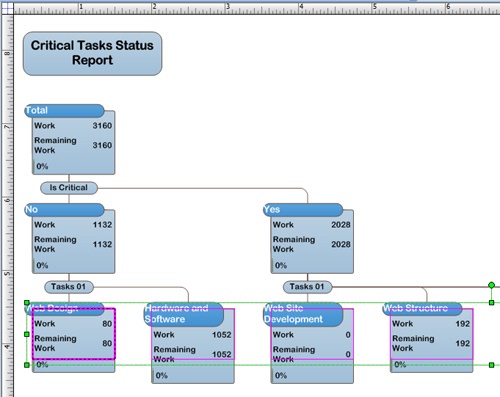
Generate the Critical Tasks Status Report. Click Report, Visual Reports. Click the Task Summary tab and then double-click either Critical Tasks Status Report (Metric) or Critical Tasks Status Report (US). Microsoft Office Visio 2007 opens to show the project’s critical tasks in an Office Visio PivotDiagram (see Figure 9-11).
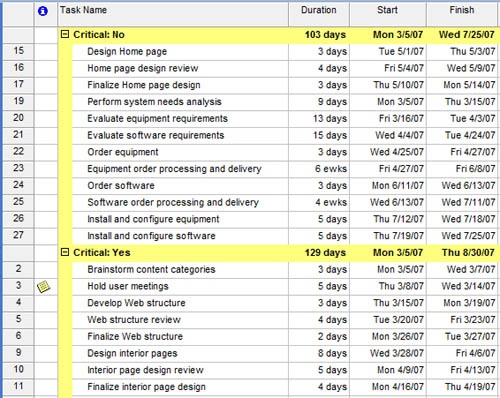
Group tasks by critical and noncritical tasks. Click Project, Group By, Critical. Tasks are grouped by whether they are critical or noncritical (see Figure 9-12). To return tasks to their original order, click Project, Group By, No Group. You can also use the Group By tool on the Standard toolbar.
Filter for critical tasks. Click Project, Filtered For, Critical. Only critical tasks are shown. To show all tasks again, click Project, Filtered For, All Tasks. You can also use the Filter tool on the Formatting toolbar.
Use the Project Guide. On the Project Guide toolbar, click Report. Click the See The Project’s Critical Tasks link. The view changes to a Critical Tasks Gantt generated by the Project Guide. Additional information is provided in the Project Guide task pane.