
21.4 Experiments for BP
As noted in the introduction, there are some important differences between BP and DP. One is that BP prioritizes individual spectral bands based on their contained information, whereas DP prioritizes spectral dimensions according to the information contained in their transformed components from the entire image data. Therefore, spectral bands only share information provided by interband correlation compared to spectral components that only retain information of residuals resulting from all their previous spectral components. Accordingly, BP and DP have different utilities in applications. This section presents applications of BP using different sets of prioritized spectral bands in unsupervised spectral unmixing and endmember extraction, which are not applicable to DP. The HYDICE image scene in Figure 1.15(a) and (b) was selected for experiments to allow us to perform a quantitative analysis in performance of unmixing panel pixels and extracting panel pixels as endmembers.
21.4.1 Applications Using Highest-Prioritized Bands
When it comes to BP, a natural and intuitive approach is to select bands that have the highest-priority scores. Table 21.2 tabulates the first 30 bands with highest-priority scores selected progressively by various BP criteria developed in Section 21.3 with a backslash “/” used to separate two selected bands. It is very clear to see from the table that if one spectral band is selected with a high-priority score, so are its neighboring spectral bands due to their strong interband correlation.
Table 21.2 30 highest-prioritized spectral bands selected progressively by various 10 BP criteria.
| 30 highest-priority scores | |
| Variance | (First 10 bands) 60/61/67/66/65/59/57/68/62/64 (Second 10 bands) 56/78/77/76/79/63/53/80/58/75 (Third 10 bands) 52/81/55/69/54/49/50/82/48/51 |
| SNR | (First 10 bands) 78/80/93/91/92/95/89/94/90/88 (Second 10 bands) 102/96/79/82/105/62/107/108/104/109 (Third 10 bands) 101/110/103/63/106/77/61/111/70/112 |
| Skewness | (First 10 bands) 1/122/123/124/125/126/50/49/127/2 (Second 10 bands) 48/169/168/47/51/128/46/129/45/167 (Third 10 bands) 130/22/23/166/21/44/18/20/131/24 |
| Kurtosis | (First 10 bands) 1/59/60/61/62/64/63/65/66/58 (Second 10 bands) 67/68/69/57/70/80/82/81/72/79 (Third 10 bands) 78/77/76/75/71/74/83/56/84/85 |
| Entropy | (First 10 bands) 65/60/67/53/66/61/52/68/59/64 (Second 10 bands) 62/78/77/57/79/49/76/56/50/80/ (Third 10 bands) 48/63/51/47/75/45/58/81/46/54 |
| ID | (First 10 bands) 154/157/156/153/150/158/145/164/163/160 (Second 10 bands) 142/144/148/143/141/152/155/135/146/159 (Third 10 bands) 166/149/138/139/167/161/165/147/151/137 |
| FLDA | (First 10 bands) 56/81/55/21/35/42/4/52/53/12 (Second 10 bands) 2/74/8/57/11/5/1/16/19/54 (Third 10 bands) 26/24/51/27/10/20/3/49/34/13 |
| OSP | (First 10 bands) 60/57/59/61/56/66/65/67/62/64 (Second 10 bands) 68/58/63/77/78/76/79/80/69/55 (Third 10 bands) 81/75/82/70/74/54/83/71/92/93 |
| BCM/BDM | (First 10 bands) 125/169/168/164/146/124/165/128/167/135 (Second 10 bands) 122/160/159/161/162/163/126/166/129/151 (Third 10 bands) 123/155/156/49/130/158/157/154/50/127 |
| BCC/BDC | (First 10 bands) 125/169/124/164/167/161/163/168/146/129 (Second 10 bands) 123/155/151/166/158/130/156/135/152/153 (Third 10 bands) 133/139/150/134/141/144/147/50/148/127 |
With each BPC, the 30 bands in Table 21.2 are separated by three categories, first highest-prioritized 10 bands, second highest-prioritized 10 bands, and third highest-prioritized 10 bands to evaluate the effectiveness of each BP criterion in performance analysis by adding the next 10 highest-prioritized bands at a time progressively until reaching a total number of 30 bands. It is also noted that the uniform band selection is not included in Table 21.2 since it does not prioritize bands and will not be evaluated along with BPC in the following applications for fair comparison.
21.4.1.1 Unsupervised Linear Spectral Mixture Analysis
The spectral unmixing technique used in this section was the unsupervised fully constrained least squares (UFCLS) in Chapter 8 to unmix data sample vectors into a set of abundance fractions specified by signatures that were used to form a linear mixing model. Table 21.2 tabulates those bands selected by 10 BP criteria with ![]() indicating the number of bands to be selected by a BPC. There were three cases considered, that is,
indicating the number of bands to be selected by a BPC. There were three cases considered, that is, ![]() = 10, 20, and 30. We assume that no prior knowledge was provided about the image scene. Therefore, the unmixing was performed in an unsupervised fashion. In this case, an unsupervised algorithm, automatic target generation process (ATGP) in Chapter 8, was implemented to generate the desired signatures directly from the image scene to be used to form the signature matrix for supervised spectral unmixing. It should be noted that since a
= 10, 20, and 30. We assume that no prior knowledge was provided about the image scene. Therefore, the unmixing was performed in an unsupervised fashion. In this case, an unsupervised algorithm, automatic target generation process (ATGP) in Chapter 8, was implemented to generate the desired signatures directly from the image scene to be used to form the signature matrix for supervised spectral unmixing. It should be noted that since a ![]() bands-formed image cube has only
bands-formed image cube has only ![]() dimensions that could be used for orthogonality projection, only
dimensions that could be used for orthogonality projection, only ![]() target pixels could be generated by ATGP. Using these
target pixels could be generated by ATGP. Using these ![]() ATGP-generated target pixels to form a desired signature matrix M, a fully constrained least squares (FCLS) classification method (Heinz and Chang, 2001; Chang, 2003a) was then used to perform spectral unmixing. The selection of FCLS over other abundance-unconstrained or partially constrained unmixing methods such as OSP was due to the fact that the knowledge provided by the
ATGP-generated target pixels to form a desired signature matrix M, a fully constrained least squares (FCLS) classification method (Heinz and Chang, 2001; Chang, 2003a) was then used to perform spectral unmixing. The selection of FCLS over other abundance-unconstrained or partially constrained unmixing methods such as OSP was due to the fact that the knowledge provided by the ![]() generated target pixels was pixel information and usually sensitive to spectral unmixing. In this case, fully constrained methods were more appropriate to reduce sensitivity. Figure 21.1(a)–(j) shows the UFCLS-mixed pixel abundance fractional maps of the 19 panel pixels resulting from
generated target pixels was pixel information and usually sensitive to spectral unmixing. In this case, fully constrained methods were more appropriate to reduce sensitivity. Figure 21.1(a)–(j) shows the UFCLS-mixed pixel abundance fractional maps of the 19 panel pixels resulting from ![]() = 10, 20, and 30 bands in Table 21.2 prioritized by the 10 BP criteria where ATGP was used to generate target information being unsupervised.
= 10, 20, and 30 bands in Table 21.2 prioritized by the 10 BP criteria where ATGP was used to generate target information being unsupervised.

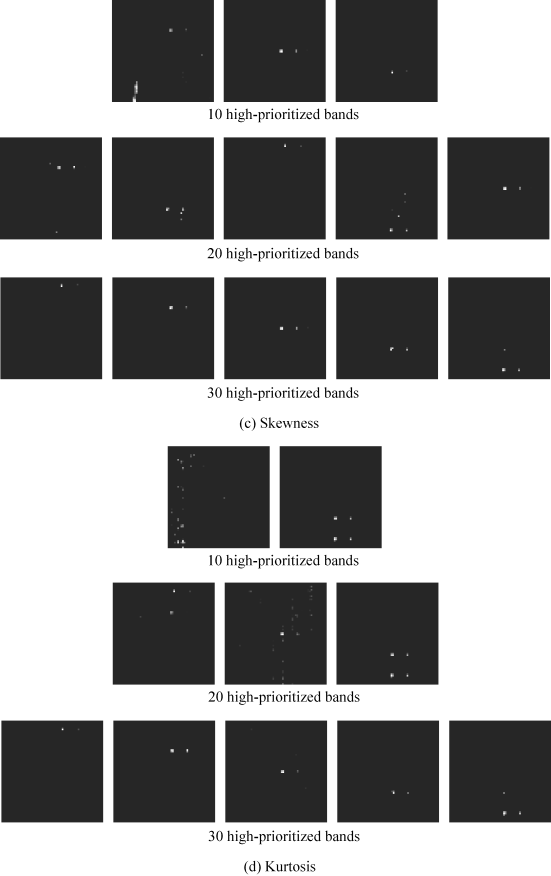
As shown in Figure 21.1, when ![]() = 10, the best UFCLS-mixed results were those produced by the ID, BCM/BDM and BCC/BDC where 19 panel pixels were classified into four separate abundance fractional maps with panel pixels in rows 2 and 3 unmixed into one single abundance fractional map. As
= 10, the best UFCLS-mixed results were those produced by the ID, BCM/BDM and BCC/BDC where 19 panel pixels were classified into four separate abundance fractional maps with panel pixels in rows 2 and 3 unmixed into one single abundance fractional map. As ![]() was increased to 20, only the unmixed results produced by BCM/BDM and skewness were able to correctly unmix all the 19 panel pixels into five separate abundance fractional maps. When
was increased to 20, only the unmixed results produced by BCM/BDM and skewness were able to correctly unmix all the 19 panel pixels into five separate abundance fractional maps. When ![]() was progressively reached 30, UFCLS using all the 10 BP criteria could successfully unmix all the 19 panel pixels into the abundance fractional maps to which they belonged. These experiments demonstrate that
was progressively reached 30, UFCLS using all the 10 BP criteria could successfully unmix all the 19 panel pixels into the abundance fractional maps to which they belonged. These experiments demonstrate that ![]() = 10 may not be sufficiently enough to preserve necessary panel pixel information for UFCLS, while
= 10 may not be sufficiently enough to preserve necessary panel pixel information for UFCLS, while ![]() = 30 may provide information more than what we needed. Therefore, it seemed that
= 30 may provide information more than what we needed. Therefore, it seemed that ![]() = 20 was an appropriate number for UFCLS to perform spectral unmixing effectively. According to the recent work in Chang and Wang (2006), VD was shown to provide a good estimate on the number of dimensions required to be preserved for DR as well as the number of endmembers for the same HYDICE image scene in Figure 1.15(a). Based on the experiments in Chapter 5, the value estimated by VD is nVD = 9 with PF = 10−3 or 10−4 in Chang (2003a). Using nVD = 9 as a guideline, it seemed that for UFCLS the twice nVD, that is, 2nVD could be an appropriate value for
= 20 was an appropriate number for UFCLS to perform spectral unmixing effectively. According to the recent work in Chang and Wang (2006), VD was shown to provide a good estimate on the number of dimensions required to be preserved for DR as well as the number of endmembers for the same HYDICE image scene in Figure 1.15(a). Based on the experiments in Chapter 5, the value estimated by VD is nVD = 9 with PF = 10−3 or 10−4 in Chang (2003a). Using nVD = 9 as a guideline, it seemed that for UFCLS the twice nVD, that is, 2nVD could be an appropriate value for ![]() to be used for a BP criterion. In this HYDICE scene, it was 18 that was close to
to be used for a BP criterion. In this HYDICE scene, it was 18 that was close to ![]() = 20. As a matter of fact, it was indeed the case where the unmixed results for
= 20. As a matter of fact, it was indeed the case where the unmixed results for ![]() = 18 were very close to those with
= 18 were very close to those with ![]() = 20 in Figure 21.1(a)–(j) and their results are not included in here. This fact was further confirmed and justified by unsupervised LSMA in Chapter 17.
= 20 in Figure 21.1(a)–(j) and their results are not included in here. This fact was further confirmed and justified by unsupervised LSMA in Chapter 17.
It is worth noting that ![]() = 9 was shown to be sufficient for DR in Wang and Chang (2006), but it may not be enough for a BPC for band selection as demonstrated above. This is because DR is performed in the sense of data compaction via a transform compared to BS that only selects separate and individual bands without accounting for interband information. As expected, it will require more bands for BS than dimensions required for DR to have both to perform comparably. Although the selection of 2nVD was empirical, our experiments show that it was a reliable estimate for the
= 9 was shown to be sufficient for DR in Wang and Chang (2006), but it may not be enough for a BPC for band selection as demonstrated above. This is because DR is performed in the sense of data compaction via a transform compared to BS that only selects separate and individual bands without accounting for interband information. As expected, it will require more bands for BS than dimensions required for DR to have both to perform comparably. Although the selection of 2nVD was empirical, our experiments show that it was a reliable estimate for the ![]() as long as a good BP criterion such as BCM/BDM was used.
as long as a good BP criterion such as BCM/BDM was used.
21.4.1.2 Endmember Extraction
This section presents another application, endmember extraction, which has recently received considerable interest in hyperspectral image analysis. The endmember extraction algorithm to be used in our experiments was the iterative N-finder algorithm (IN-FINDR) developed in Section 7.2.3.2. However, it should be pointed out that there was no particular reason to select IN-FINDR to perform endmember extraction. Any endmember extraction algorithm can also be used for the same purpose such as pixel purity index (PPI).
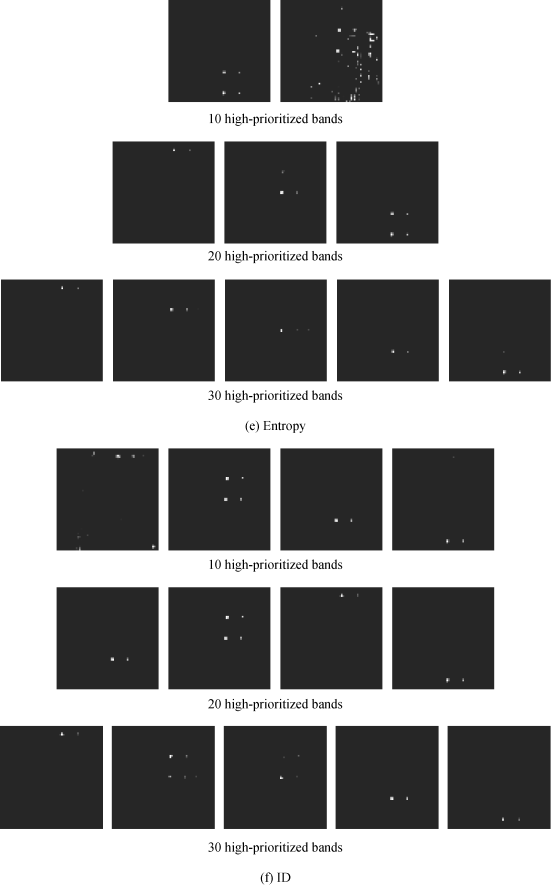
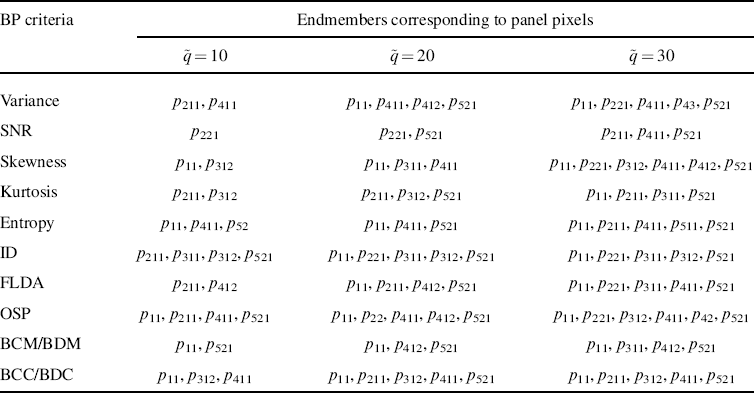
Following the same experiments conducted in Section 21.4.1.1, Figure 21.2(a)–(j) shows the endmembers extracted by IN-FINDR using highest-prioritized bands with ![]() = 10, 20, and 30 according to the 10 various BP criteria in Table 21.2, where the extracted endmembers corresponding to panel signatures are marked by green triangles and the remaining extracted endmembers are marked by red circles.
= 10, 20, and 30 according to the 10 various BP criteria in Table 21.2, where the extracted endmembers corresponding to panel signatures are marked by green triangles and the remaining extracted endmembers are marked by red circles.
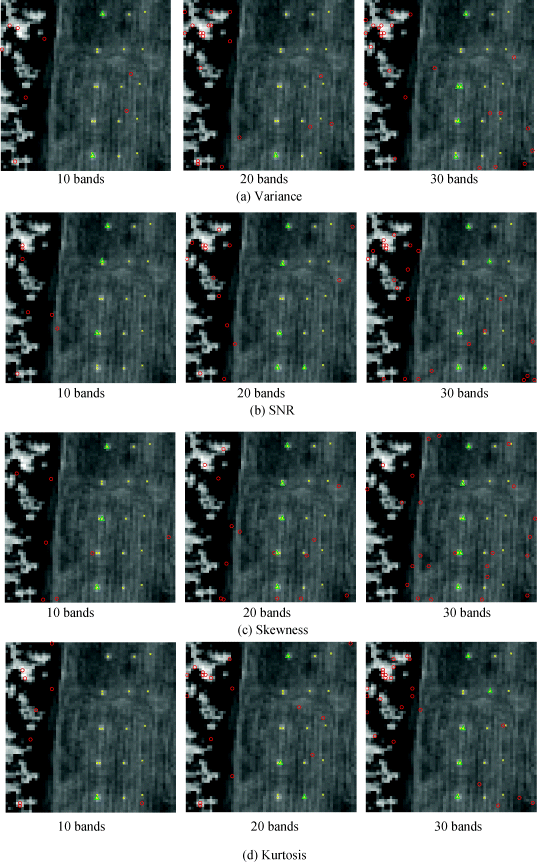
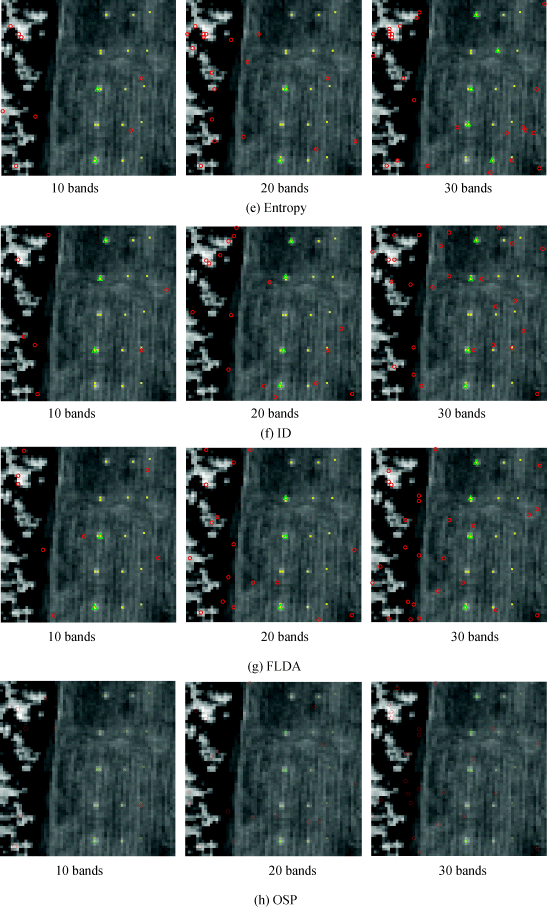

Table 21.3 also lists the endmembers extracted in Figure 21.2 that correspond to 19 R panel pixels in Figure 1.15(b).
Table 21.3 Endmembers corresponding to R panel pixels extracted in Figure 21.2

From Table 21.3, none of 10 BP criteria could extract five panel signatures when ![]() = 10. The best results were those produced by SNR, skewness, ID, and BCM/BDM, which extracted three panel pixels. However, if
= 10. The best results were those produced by SNR, skewness, ID, and BCM/BDM, which extracted three panel pixels. However, if ![]() was increased to 20, the skewness was able to extract five endmembers corresponding to R panel pixels that represent five pure panel signatures. If the
was increased to 20, the skewness was able to extract five endmembers corresponding to R panel pixels that represent five pure panel signatures. If the ![]() was further increased to 30, SNR, skewness, kurtosis, entropy, and BCM/BDM can all extracted five endmembers corresponding to R panel pixels that represent five pure panel signatures. Like unsupervised spectral unmixing,
was further increased to 30, SNR, skewness, kurtosis, entropy, and BCM/BDM can all extracted five endmembers corresponding to R panel pixels that represent five pure panel signatures. Like unsupervised spectral unmixing, ![]() = 20 was shown once again to be a good estimate for
= 20 was shown once again to be a good estimate for ![]() in endmember extraction, provided that a BP criterion was appropriately selected. These two applications demonstrated two important observations. One is that as noted at the end of Section 21.4.1.1, DR required fewer dimensions than the number of bands required by BS because DR performed data compaction compared to BS that only selects a subset of bands while discarding all the information provided by un-selected bands. As a result, VD provided a very good estimate for DR (Wang and Chang, 2006b). Nevertheless, VD can be actually used to estimate the value of
in endmember extraction, provided that a BP criterion was appropriately selected. These two applications demonstrated two important observations. One is that as noted at the end of Section 21.4.1.1, DR required fewer dimensions than the number of bands required by BS because DR performed data compaction compared to BS that only selects a subset of bands while discarding all the information provided by un-selected bands. As a result, VD provided a very good estimate for DR (Wang and Chang, 2006b). Nevertheless, VD can be actually used to estimate the value of ![]() for BP criteria, which is twice VD-estimated value, 2nVD. The second observation shows a significance difference between DR and BS in the sense of information preservation. Since DR performs data compaction via a transform, it is expected that most significant information has been transformed and preserved in the first few principal dimensions. By contrast, BS does not compact information as DR does. Instead, it selects the most significant bands to preserve desired information without taking advantage of transformed information. Consequently, it is anticipated that given the same number of bands and dimensions/components, the information preserved by DR is generally greater than that by BS. Consequently, BS requires more bands than DR in order for BS to preserve the same level of information by DR.
for BP criteria, which is twice VD-estimated value, 2nVD. The second observation shows a significance difference between DR and BS in the sense of information preservation. Since DR performs data compaction via a transform, it is expected that most significant information has been transformed and preserved in the first few principal dimensions. By contrast, BS does not compact information as DR does. Instead, it selects the most significant bands to preserve desired information without taking advantage of transformed information. Consequently, it is anticipated that given the same number of bands and dimensions/components, the information preserved by DR is generally greater than that by BS. Consequently, BS requires more bands than DR in order for BS to preserve the same level of information by DR.
21.4.2 Applications Using Least-Prioritized Bands
It is a common practice that BS must select bands with highest-priority scores. However, it turns out that such an approach does not necessarily yield the best performance in some applications. More specifically, on some occasions selecting bands with the least-priority scores may produce better results. The significance of selecting least-priority bands may be due to the fact that subtle information such as small targets or anomalies can be only preserved and captured by bands with least-priority scores rather than those with highest-priority scores if a selected BP criterion is second-order statistics. In the following, we investigated this interesting issue, which has not been explored in the past.
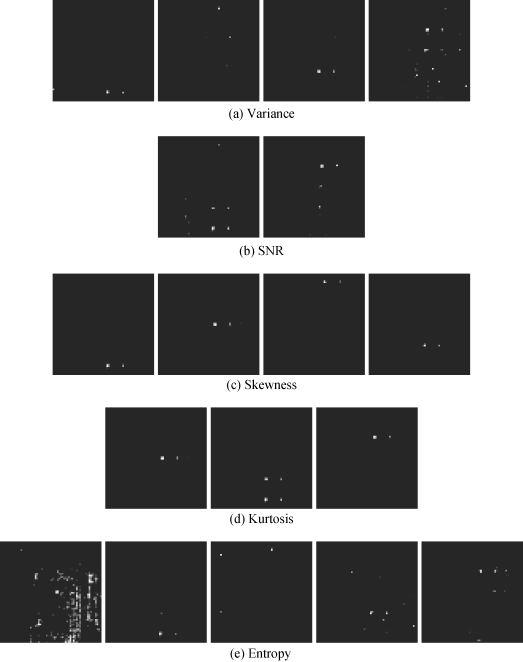
To shed light on this issue, a simple experiment using principal components analysis (PCA) was performed to provide insight into the use of bands with least-priority scores. Since the 19 panel pixels in the HYDICE scene in Figure 1.15(a) can be considered as small and rare targets with respect to the entire image scene, the PCA-based principal components and second-order statistics-based BP criteria may not be effective to capture the characteristics of these 19 panel pixels, which instead may be hidden in minor components. In order to validate our assumption, once again IN-FINDR using nine PCA-generated principal components (PCs) and nine minor components (MCs) were implemented where Figure 21.3(a) and (b) shows their respective results. As we can see from the figure, three panel pixels p11, p312, p521 were extracted by using nine MCs in Figure 21.3(b) compared to the only two panel pixels p312, p521 extracted by using nine PCs in Figure 21.3(a).
Figure 21.3 Nine endmembers extracted by IN-FINDR using nine PCs and nine MCs.

Inspired by the results in Figure 21.3, we repeated the same experiments conducted in previous sections and compared the results against those results obtained by highest-prioritized bands. Table 21.4 lists the first 30 bands with least-priority scores selected by 10 various BP criteria with a backslash “/” used to separate two selected bands. As also noted, if one band had lower-priority scores, its neighboring bands also had similar lower-priority scores. Due to the fact that the uniform band selection does not involve BP, its experiments are not included.
Table 21.4 30 least-prioritized bands selected progressively by various 10 BP criteria.
| 30 least-priority scores | |
| Variance | (First 10 bands) 168/169/167/164/125/124/165/166/163/162 (Second 10 bands) 160/161/159/157/158/156/154/155/123/153 (Third 10 bands) 126/130/152/129/122/151/150/131/149/148 |
| SNR | (First 10 bands) 1/2/3/4/5/6/7/8/168/9 (Second 10 bands) 10/169/167/11/12/164/165/13/166/163 (Third 10 bands) 14/15/68/16/124/125/162/160/161/18 |
| Skewness | (First 10 bands) 95/93/94/92/96/91/90/89/88/87 (Second 10 bands) 97/55/85/86/81/82/79/83/80/77 (Third 10 bands) 76/78/75/74/84/111/112/110/113/54 |
| Kurtosis | (First 10 bands) 50/49/48/47/51/46/45/44/43/42 (Second 10 bands) 41/22/23/24/40/21/25/20/39/19 (Third 10 bands) 18/26/52/17/38/16/27/15/14/37 |
| Entropy | (First 10 bands) 168/169/167/164/165/124/125/166/163/162 (Second 10 bands) 160/161/159/157/158/156/154/155/153/123 (Third 10 bands) 152/130/126/151/129/122/150/149/131/148 |
| ID | (First 10 bands) 43/9/23/42/52/45/37/71/49/47 (Second 10 bands) 39/48/50/26/38/40/44/51/20/6 (Third 10 bands) 41/73/29/36/46/17/27/25/12/21 |
| FLDA | (First 10 bands) 166/163/161/76/164/169/157/120/167/75 (Second 10 bands) 153/165/159/155/156/162/160/168/154/148 (Third 10 bands) 125/32/70/113/152/88/150/143/73/146 |
| OSP | (First 10 bands) 168/169/167/124/125/164/165/166/163/162 (Second 10 bands) 160/161/159/158/157/156/123/130/126/155 (Third 10 bands) 151/129/150/154/152/122/149/153/131/148 |
| BCM/BDM | (First 10 bands) 59/60/66/67/65/57/61/64/56/68 (Second 10 bands) 62/78/77/76/58/80/55/81/69/63 (Third 10 bands) 70/79/75/82/74/92/54/93/91/95 |
| BCC/BDC | (First 10 bands) 165/128/162/49/126/159/160/17/45/43 (Second 10 bands) 25/8/38/16/19/14/59/65/61/60 (Third 10 bands) 66/67/57/62/64/56/68/63/78/79 |
With each BPC the 30 bands in Table 21.4 are separated by three categories, first set of least-prioritized 10 bands, second set of follow-up least-prioritized 10 bands, and third set of the next follow-up least-prioritized 10 bands to evaluate the effectiveness of each BPC in performance analysis by adding the next 10 least-prioritized bands at a time until reaching a total number of 30 least-prioritized bands.
21.4.2.1 Unsupervised Linear Spectral Mixture Analysis
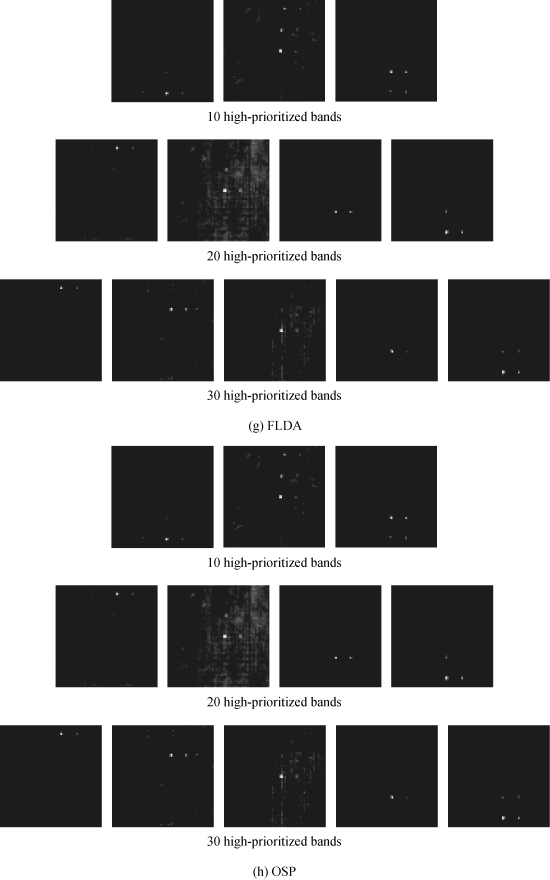
Like the experiments in Section 21.4.1.1 the unsupervised spectral unmixing was performed in exactly the same manner for ![]() = 10, 20, and 30 except that the least-prioritized bands in Table 21.4 were selected to form new data sets to replace the original 169-band HYDICE image scene. ATGP was also used to generate
= 10, 20, and 30 except that the least-prioritized bands in Table 21.4 were selected to form new data sets to replace the original 169-band HYDICE image scene. ATGP was also used to generate ![]() target pixels to form the desired signature matrix for FCLS. Figure 21.4(a)–(j) shows the UFCLS-mixed pixel abundance fractional maps of the 19 panel pixels resulting from using
target pixels to form the desired signature matrix for FCLS. Figure 21.4(a)–(j) shows the UFCLS-mixed pixel abundance fractional maps of the 19 panel pixels resulting from using ![]() = 10, 20, and 30 least-prioritized bands selected by the 10 BP criteria in Table 21.4.
= 10, 20, and 30 least-prioritized bands selected by the 10 BP criteria in Table 21.4.
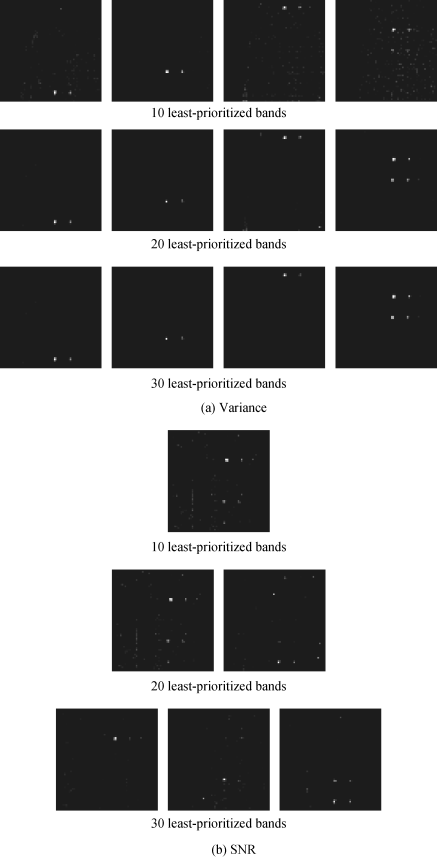


Comparing the results in Figure 21.4 to those in Figure 21.1, the unmixing performances using highest-prioritized and least-prioritized bands were quite different. For example, the best performance using the first 20 least-prioritized bands was produced by the BCC/BDC in Figure 21.4(j) compared to the results produced by both the skewness in Figure 21.1(c) and BCM/BDM in Figure 21.1(i) using the first 20 highest-prioritized bands.
It should be noted that the panels in HYDICE data are relatively small and they are only of the one-pixel or two-pixel size. As a result, their spectral characteristics may not be captured by some BP criteria such as variance using highest-prioritized band, but rather by least-prioritized bands since these panels do not generally contribute much to data variance and thus do not appear in highest-prioritized bands, a fact also justified by minor components when PCA is used. Therefore, the above experiments demonstrated that selecting bands with least-priority scores could be an alternative BS to improve performance.
21.4.2.2 Endmember Extraction
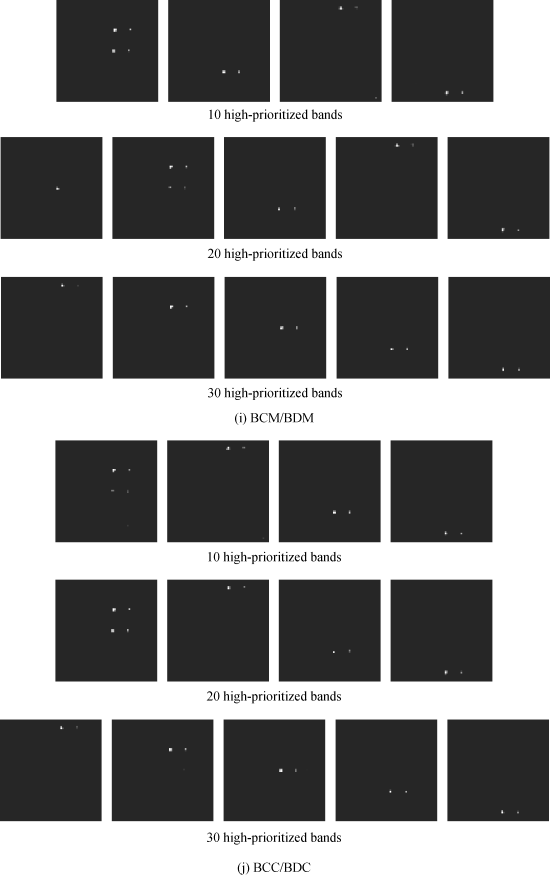
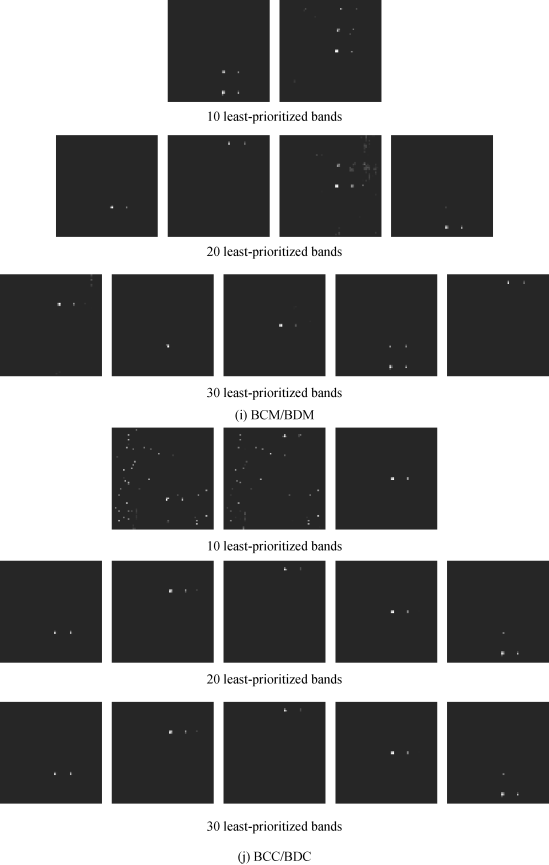
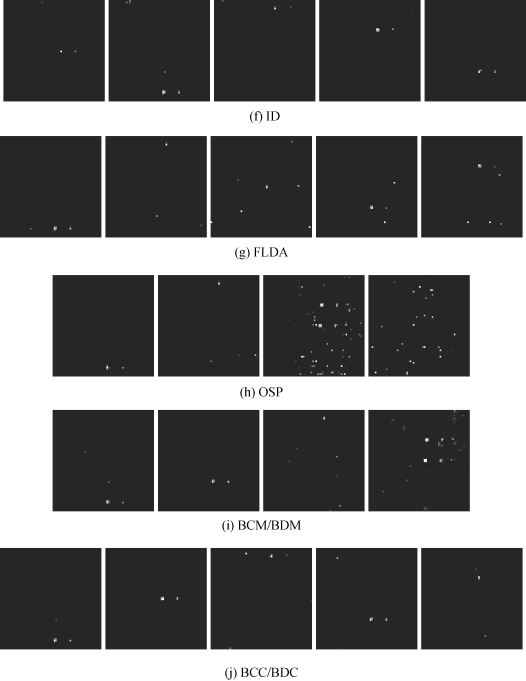
Once again, the same experiments conducted in Section 21.4.1.2 were also performed for endmember extraction except that the first 30 least-prioritized bands were used. Figure 21.5(a)–(j) shows the endmembers extracted by IN-FINDR using ![]() least-prioritized bands with
least-prioritized bands with ![]() = 10, 20, and 30 according to the 10 various BP criteria in Table 21.4, where the extracted endmembers corresponding to panel signatures are marked by green triangles and the remaining extracted endmembers are marked by red circles.
= 10, 20, and 30 according to the 10 various BP criteria in Table 21.4, where the extracted endmembers corresponding to panel signatures are marked by green triangles and the remaining extracted endmembers are marked by red circles.


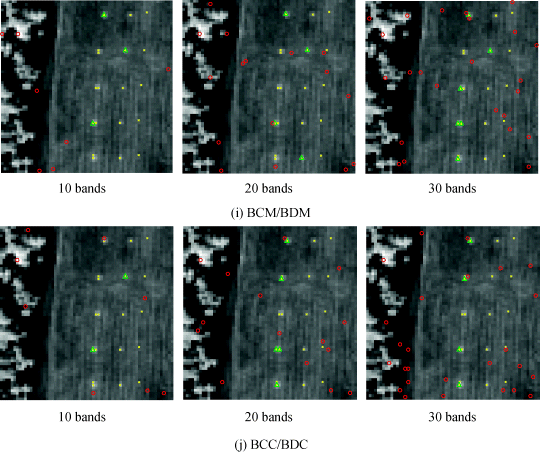
Table 21.5 summarizes the IN-FINDR-extracted endmembers in Figure 21.5 that corresponded to panel pixels representing the five distinct panel signatures.
Table 21.5 Endmembers extracted in Figure 21.5 that correspond to panel pixels.
From the results in Figure 21.5 and Table 21.5, the only one to extract the five distinct panel signatures with ![]() = 20 bands with least-priority scores is the BCC/BDC. This was different from the results in Figure 21.2 and Table 21.3 where the skewness using
= 20 bands with least-priority scores is the BCC/BDC. This was different from the results in Figure 21.2 and Table 21.3 where the skewness using ![]() = 20 bands with highest-priority scores was the only one to extract the five distinct panel signatures.
= 20 bands with highest-priority scores was the only one to extract the five distinct panel signatures.
21.4.3 Applications Using Mixing Highest-Prioritized and Least-Prioritized Bands
As shown in Sections 21.4.1 and 21.4.2 using highest-prioritized and least-prioritized spectral bands had different advantages. In this section it will be interesting to see if using a combined set of highest- and least-prioritized spectral bands can take both advantages as demonstrated by using mixed component analysis for spectral/spatial compression in Example 19.5 in Chapter 19.
21.4.3.1 Unsupervised Linear Spectral Mixture Analysis
According to experiments in Figures 21.1 and 21.4, 20 bands seemed to be an appropriate estimate for the value of ![]() used by BS. So, in this section, only the experiments using 20 bands were conducted for a comparative analysis. In this case, we mixed the 10 highest-prioritized and the 10 least-prioritized bands to make
used by BS. So, in this section, only the experiments using 20 bands were conducted for a comparative analysis. In this case, we mixed the 10 highest-prioritized and the 10 least-prioritized bands to make ![]() = 20 spectral bands to implement UFCLS for spectral unmixing. Figure 21.6(a)–(j) shows the unmixed results produced by using the 10 BP criteria listed in Tables 21.1.
= 20 spectral bands to implement UFCLS for spectral unmixing. Figure 21.6(a)–(j) shows the unmixed results produced by using the 10 BP criteria listed in Tables 21.1.
Figure 21.6 UFCLS-mixed pixel results produced by 10 BP criteria with ![]() = 20 using the 10 highest- prioritized and the 10 least-prioritized bands.
= 20 using the 10 highest- prioritized and the 10 least-prioritized bands.
As noted in Sections 21.4.1 and 21.4.2, if only 20 bands were allowed to implement UFCLS, only the skewness and BCM/BDM in Figure 21.1 and the BCC/BDC in Figure 21.4 could unmix panel pixels in their corresponding five rows. However, if these 20 bands were selected by mixing 10 highest-prioritized and 10 least-prioritized bands, Figure 21.6 shows that there were four BP criteria, entropy, ID, FLDA, and BCC/BDC that could indeed achieve better unmixed results for the 19 panel pixels. These experiment demonstrated that using 20 highest-prioritized bands or 20 least-prioritized bands alone may not be as effective as mixing 10 highest-prioritized bands and 10 least-prioritized bands. However, this conclusion was not true in endmember extraction as will be demonstrated in the following section.
21.4.3.2 Endmember Extraction
Interestingly, if we implemented the same 10 BP criteria by selecting their first 10 bands with highest-priority scores in Table 21.2 and 10 bands with least-priority scores in Table 21.4 to make up ![]() = 20 bands, the 20 endmembers extracted by IN-FINDR are shown in Figure 21.7 where the endmembers marked by triangles and open circles represent panel and non-panel pixels, respectively.
= 20 bands, the 20 endmembers extracted by IN-FINDR are shown in Figure 21.7 where the endmembers marked by triangles and open circles represent panel and non-panel pixels, respectively.
Figure 21.7 Endmembers extracted by IN-FINDR using the first 10 highest-prioritized and 10 least- prioritized bands.

Table 21.6 also tabulates the panel pixels extracted in Figure 21.7 along with the results from Table 21.3 and Table 21.5 for ![]() = 20 for comparison.
= 20 for comparison.
Table 21.6 Comparison between 10 BP criteria by using three different band selection methods, which are 20 highest- 20 least-, and 10 highest + 10 least prioritized bands.
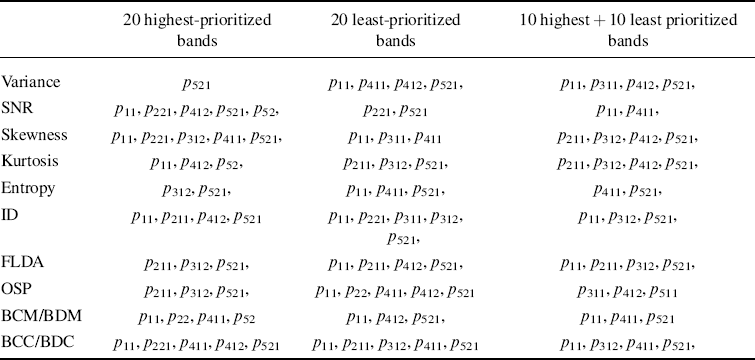
Unlike the results produced by unsupervised spectral unmixing in Figure 21.6, Table 21.6 demonstrated that endmember extraction using a combination of the first 10 highest-prioritized and the first 10 least-prioritized bands did not necessarily perform better than that using only the first 20 highest-prioritized bands or the first 20 least-prioritized bands alone. As a matter of fact, none of the 10 BP criteria could extract the five distinct panel signatures compared to the skewness using the first 20 highest-prioritized bands and the BCC/BDC using the first 20 least-prioritized bands that could pull out all the five panel signatures. Nevertheless, endmember extraction was more effective if the first 20 least-prioritized bands were used for most of the 10 BP criteria. This is mainly due to the fact that endmembers are usually considered as rare signatures and insignificant targets in which case only least-prioritized bands can effectively preserve their information.
As a final remark, all the results in Sections 21.4.2 and 21.4.3 provided solid evidence that ![]() = 20 was in fact a very good estimate for the number of spectral bands to be selected for spectral unmixing and endmember extraction. The number of 20 was very close to 18, which is twice VD-estimated value, nVD = 9 with PF = 10−4 which was further confirmed by the experiments conducted in Chapter 17.
= 20 was in fact a very good estimate for the number of spectral bands to be selected for spectral unmixing and endmember extraction. The number of 20 was very close to 18, which is twice VD-estimated value, nVD = 9 with PF = 10−4 which was further confirmed by the experiments conducted in Chapter 17.
As another example for endmember extraction, the real Cuprite data in Figure 1.12(a) is also used to conduct similar experiments for comparison. It should be noted that unlike the HYDICE, which provides complete knowledge of all 19 R panel pixels, the ground truth provided by the Cuprite image scene does not include complete knowledge of all mineral signatures. In this case, the two supervised BP criteria, OSP and FLDA, were not used for a comparative study.
VD for this image scene was estimated with various false alarm probabilities in Table 5.6. For our experiments, nVD = 22 is chosen with PF = 10−4 with HFC method used for VD estimation. This number was also used for the same image scene for endmember extraction in Chang et al. (2006).
Following the same experiments conducted for endmember extraction in Sections 21.4.1.2 and 21.4.2.2, Tables 21.7 and 21.8 list the first 40 highest-prioritized bands and first 40 least-prioritized bands, respectively, where 40 was approximately twice the value estimated by VD that is 44 = 2nVD.
Table 21.7 40 Highest-prioritized bands progressively selected by various 10 BP criteria.
| 40 highest priority scores | |
| Variance | (First 10 bands) 87/85/88/86/89/84/91/80/78/90 (Second 10 bands) 92/83/82/79/93/81/98/99/97/189 (Third 10 bands) 77/76/75/94/100/74/96/95/73/72 (Fourth 10 bands) 101/71/70/69/68/67/123/124/122/121 |
| SNR | (First 10 bands) 68/71/67/69/70/72/66/73/65/26 (Second 10 bands) 74/25/27/23/24/28/22/64/89/21 (Third 10 bands) 75/63/87/88/85/86/20/91/19/18 (Fourth 10 bands) 83/84/42/29/53/90/76/52/39/17 |
| Skewness | (First 10 bands) 2/1/3/4/5/6/7/8/9/10 (Second 10 bands) 11/12/13/14/184/15/185/183/181/16 (Third 10 bands) 179/178/180/182/17/177/170/171/18/19 (Fourth 10 bands) 159/169/20/158/176/157/21/22/23/186 |
| Kurtosis | (First 10 bands) 2/3/1/4/5/6/7/8/9/185 (Second 10 bands) 181/183/184/10/179/178/180/170/182/177 (Third 10 bands) 11/169/171/12/176/13/172/14/159/158/ (Fourth 10 bands) 168/157/156/175/155/15/154/160/167/173 |
| Entropy | (First 10 bands) 87/82/88/85/76/83/89/77/80/101 (Second 10 bands) 86/100/74/98/81/99/71/84/75/91 (Third 10 bands) 78/70/79/69/73/92/72/68/90/110 (Fourth 10 bands) 62/63/64/130/111/61/129/58/109/57 |
| ID | (First 10 bands) 6/2/124/117/11/123/12/96/125/9 (Second 10 bands) 13/15/10/126/122/14/7/16/5/165 (Third 10 bands) 112/1/8/4/167/3/164/166/114/163 (Fourth 10 bands) 162/19/17/18/94/95/25/161/119/113 |
| BCM/BDM | (First 10 bands) 26/117/48/37/189/64/1/185/10/172 (Second 10 bands) 47/4/60/28/165/17/5/2/151/158 (Third 10 bands) 3/94/29/9/7/6/8/58/13/11 (Fourth 10 bands) 91/137/14/153/123/174/12/177/160/167 |
| BCC/BDC | (First 10 bands) 185/37/2/3/5/64/8/9/6/7 (Second 10 bands) 10/165/4/11/12/14/151/13/28/15 (Third 10 bands) 16/153/17/19/18/29/184/20/177/47 (Fourth 10 bands) 21/22/188/25/24/23/167/186/30/31 |
Table 21.8 40 Least-prioritized bands progressively selected by various 10 BP criteria.
| 40 Least priority scores | |
| Variance | (First 10 bands) 2/1/3/4/5/6/185/184/7/183 (Second 10 bands) 8/181/182/180/186/179/9/178/10/177 (Third 10 bands) 176/169/11/160/170/171/175/159/168/167 (Fourth 10 bands) 161/158/172/12/174/173/166/165/162/164 |
| SNR | (First 10 bands) 187/189/188/186/185/183/182/184/180/170 (Second 10 bands) 1/181/139/177/179/176/175/178/102/173 (Third 10 bands) 138/174/140/172/171/159/169/168/2/158/ (Fourth 10 bands) 167/164/165/136/161/160/166/156/162/157 |
| Skewness | (First 10 bands) 135/129/128/130/127/131/132/126/125/124 (Second 10 bands) 133/134/123/122/121/120/119/118/117/116 (Third 10 bands) 115/114/113/139/112/111/110/109/138/108 (Fourth 10 bands) 140/107/136/137/141/102/103/189/106/104 |
| Kurtosis | (First 10 bands) 189/123/122/121/124/120/119/125/118/101 (Second 10 bands) 126/117/116/127/115/100/99/114/98/128/ (Third 10 bands) 113/97/112/96/95/129/187/92/94/91/ (Fourth 10 bands) 111/93/90/89/110/88/130/87/86/85 |
| Entropy | (First 10 bands) 2/1/4/3/164/165/5/163/6/166 (Second 10 bands) 7/8/9/167/10/123/112/11/12/162 (Third 10 bands) 13/14/16/96/15/161/19/168/185/18 (Fourth 10 bands) 124/17/95/183/184/125/117/126/177/180 |
| ID | (First 10 bands) 100/99/87/109/88/108/110/86/85/98 (Second 10 bands) 84/83/92/130/89/131/132/133/134/107 (Third 10 bands) 135/76/82/75/74/129/101/77/91/174 (Fourth 10 bands) 111/138/175/141/80/136/140/176/173/71 |
| BCM/BDM | (First 10 bands) 122/125/121/127/129/118/120/134/132/128 (Second 10 bands) 131/130/101/115/110/92/126/99/93/100 (Third 10 bands) 98/109/82/88/108/97/116/144/86/84 (Fourth 10 bands) 96/90/83/106/102/89/103/107/105/80 |
| BCC/BDC | (First 10 bands) 26/189/48/117/158/80/124/1/122/125 (Second 10 bands) 127/183/121/128/129/120/98/70/134/119 (Third 10 bands) 131/126/118/140/130/132/115/111/79/135 (Fourth 10 bands) 116/141/113/100/123/101/96/110/95/99 |
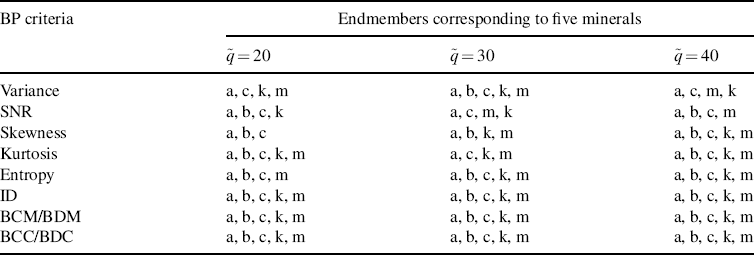
Tables 21.9 and 21.10 tabulate the IN-FINDR extracted endmembers that correspond to the five mineral signatures using ![]() highest-prioritized bands and
highest-prioritized bands and ![]() least-prioritized bands for
least-prioritized bands for ![]() = 20, 30 and 40, respectively, where extracted endmembers, denoted by lowercase letters, “a, b, c, k, m,” are identified by comparing their signatures against the signatures of the ground truth endmember pixels, upper case letters, “A, B, C, K, M” in Figure 1.12(b) by spectral similarity distance, SAM.
= 20, 30 and 40, respectively, where extracted endmembers, denoted by lowercase letters, “a, b, c, k, m,” are identified by comparing their signatures against the signatures of the ground truth endmember pixels, upper case letters, “A, B, C, K, M” in Figure 1.12(b) by spectral similarity distance, SAM.
Table 21.9 Endmembers extracted by IN-FINDR that corresponded to one of the five ground truth minerals using the first 20, 30, and 40 highest-prioritized bands.

Table 21.10 Endmembers extracted by IN-FINDR that corresponded to one of the five ground truth minerals using the first 20, 30, and 40 least-prioritized bands.
It should be noted that the IN-FINDR-found pixels were generally not the same ground truth pixels in Figure 1.12(b). Instead, they were located in different areas, but have very close signatures in the sense of SAM to those of the five mineral pixels identified in Figure 1.12(b)
As shown in Tables 21.9 and 21.10, the greater the value of ![]() was, the better the endmember extraction for BP criteria were. Nevertheless,
was, the better the endmember extraction for BP criteria were. Nevertheless, ![]() = 20 provided a very good estimate for the value of
= 20 provided a very good estimate for the value of ![]() for IN-FINDR to extract all the five mineral signatures where the three BP criteria, variance, and BCM/BDM, and BCC/BDC in Table 21.9 and the four BP criteria, kurtosis, ID, BCM/BDM, and BCC/BDC in Table 21.10 were able to pull out pixels that corresponded to all the five distinct mineral signatures. In this case, it seemed that the nVD = 22 was a good estimate for value of
for IN-FINDR to extract all the five mineral signatures where the three BP criteria, variance, and BCM/BDM, and BCC/BDC in Table 21.9 and the four BP criteria, kurtosis, ID, BCM/BDM, and BCC/BDC in Table 21.10 were able to pull out pixels that corresponded to all the five distinct mineral signatures. In this case, it seemed that the nVD = 22 was a good estimate for value of ![]() instead of twice VD-estimated value, 2nVD = 18 used in previous HYDICE experiments. If we further compare Table 21.10 to Table 21.9, it is found that for this particular cuprite image scene using the bands with the first 20 least priority scores to perform endmember extraction was more effective than using the bands with the first 20 highest priority scores.
instead of twice VD-estimated value, 2nVD = 18 used in previous HYDICE experiments. If we further compare Table 21.10 to Table 21.9, it is found that for this particular cuprite image scene using the bands with the first 20 least priority scores to perform endmember extraction was more effective than using the bands with the first 20 highest priority scores.
Finally, we implemented a mixture of the first 10 highest-prioritized bands and first 10 least-prioritized bands for endmember extraction in the same fashion as that conducted in Section 21.4.3.2. Table 21.11 tabulates the IN-FINDR extracted endmembers that correspond to the five mineral signatures.
Table 21.11 Endmember extracted by the mixture of the first 10 highest-prioritized and 10 least-prioritized bands.
| BP criteria | Endmembers corresponding to five minerals |
| Variance | a, c, m |
| SNR | a, b, c |
| Skewness | a, b, c, m |
| Kurtosis | a, c, k, m |
| Entropy | c, k, m |
| ID | a, b, c, k |
| BCM/BDM | a, b, c, k, m |
| BCC/BDC | a, b, c, k, m |
Comparing Table 21.11 to Tables 21.9 and 21.10, it was obvious that mixing the first 10 highest-prioritized bands and first 10 least-prioritized bands did not perform as well as the first 20 highest-prioritized bands or the first 20 least-prioritized bands alone did, a similar conclusion that was also observed for HYDICE experiments in Section 21.4.3.2.
Several new findings from the above experimental results are particularly interesting. One is that according to our extensive experience, BCM/BDM and BCC/BDC were generally better criteria than any other BP criteria in most applications. Another is that bands with the lower-priority scores had been shown to be more important than bands with the higher-priority scores in some applications such as endmember extraction, detection, and classification of small targets or anomalies. A third one is that as demonstrated in Chang (2006) and Chang and Wang (2006), no matter what BP criterion was used the number of spectral bands, ![]() , required for BS was generally higher than the number of spectral dimensions required to be retained after DR in order for BS to accomplish the same task as DR did. In this case, VD produces a reliable estimate for DR as shown in Wang and Chang (2006b) and Chang et al. (2006), while providing a lower bound on BS as witnessed in our experiments.
, required for BS was generally higher than the number of spectral dimensions required to be retained after DR in order for BS to accomplish the same task as DR did. In this case, VD produces a reliable estimate for DR as shown in Wang and Chang (2006b) and Chang et al. (2006), while providing a lower bound on BS as witnessed in our experiments.