
5.7 Conclusions
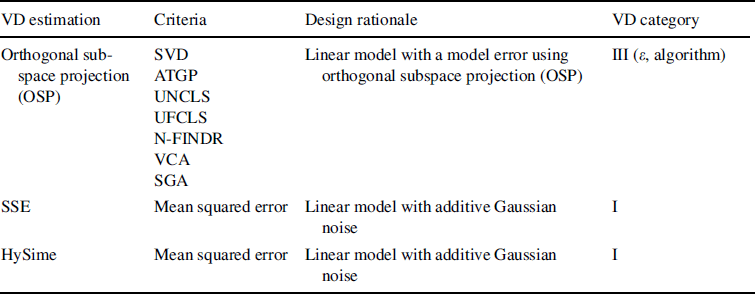
Estimating the number of signal sources/signatures is a crucial preprocessing step in hyperspectral data exploitation. Its accuracy has significant impact on image analysis and interpretation. Recently, the concept of VD proposed in Chang (2003a) and Chang and Du (2004) has shown success in estimating the number of spectrally distinct signatures present in hyperspectral imagery. The exploration of VD was also investigated for many applications (Chang, 2006). This chapter revisits the concept of VD and redefines it as a general terminology to deal with signal sources of interest in various applications where the value of VD should vary with applications of interest and should not be fixed at a single constant value that fits all applications. In order to address this need, two types of criteria, data characterization-driven criteria and data representation-driven criteria, are used to develop VD estimation techniques where the former is focused on data characterization in terms of spectral statistics regardless of applications as opposed to the latter that finds an optimal number of signal sources to best represent data via a linear model. Tables 5.13 and 5.14 categorize these two types of criteria according to their design rationales. Category I includes factor analysis-based criteria, called real error (RE). Imbedded error (IE), extracted error (XE), and empirical indicator function (EIF) proposed by Malinowski (1997a, 1977b) and two criteria arising in passive array processing, an information theoretic criterion (AIC), minimum description length (MDL), signal subspace estimation (SSE), and hyperspectral signal subspace identification by minimum error (HySime) all produce single constant values for VD and have nothing to do with any application or algorithm. Category II comprises criteria involving one parameter that can be adapted to determine various values of VD, which include error threshold (ε)-based methods (commonly used eigenvalue-based energy methods and Gershgorin radius-based methods) and false alarm probability (PF)-based methods. Category III is made up of OSP-based criteria that involve two parameters, an error threshold ε and an algorithm to be specified by a particular application to determine the value of VD.
Table 5.13 Data characterization-driven criteria.
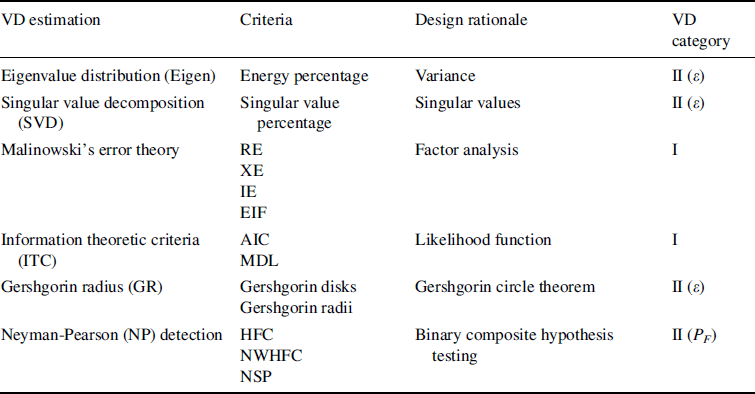
Table 5.14 Data representation characterization-driven criteria.
Tables 5.15–5.17 further summarize all criteria in Category I, Category II, and Category III, respectively, developed in this chapter based on assumptions, models, and parameters, where an asterisk (∗) indicates the best technique in a specified category.
Table 5.15 VD criteria in Category I.
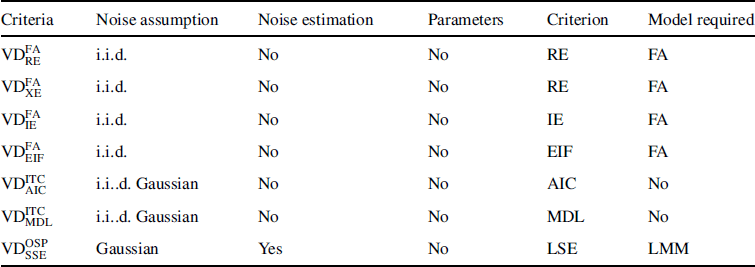
Table 5.16 VD criteria in Category II.

Table 5.17 VD criteria in Category III.

For example, SSE/HySime is considered the best criterion in Category I while the NP detection-based techniques are the best in Category II. Since there is only one technique in Category III and the performance of VD actually depends upon the application to be specified, no asterisk (∗) is assigned to the best performance. Nevertheless, according to all experiments discussed in this chapter, the techniques in Category III are generally better than the techniques in Categories I and II, with some occasions where the NP detection-based techniques in Category II can do better.