
Chapter 29
Working with Tables and Drawings
SolidWorks enables you to create several types of tables on drawings. Design tables that are used in parts and assemblies can be shown on the drawing to create a tabulated type drawing. Hole tables enable you to chart the center locations and sizes of holes for easy access to manufacturing data. Revision tables help you document the revision history of a drawing. General tables are also available for any specialized items that are not covered by the other table types.
Driving the Bill of Materials
The Bill of Materials (BOM) is one of the most frequently used types of tables that are available in SolidWorks. BOMs are intended for use with assemblies, but you can also use them with individual parts for specialized applications. The information that you can expect to see on a BOM includes item number, filename, quantity used, description, and any other custom property that you would like to add. A typical BOM is shown in Figure 29.1.

FIGURE 29.1 A sample BOM
BOMs are made in one of two ways: The default BOM is made from a SolidWorks table, while an Excel-based BOM is driven by Excel. You could also create a BOM manually using a general table, but that wouldn't take advantage of any automated functions. Although Excel offers some advantages, the SolidWorks internal table type is preferred. The default Bill of Materials tool on the Drawing toolbar leads to the SolidWorks table. The Excel BOM is available by customizing the interface, but it is no longer the default. Excel and SolidWorks table-based BOMs are not interchangeable, so if you plan to customize the default templates, you need to decide which type of BOM (Excel or SolidWorks) you want to use.
SolidWorks tables are preferred over Excel for several reasons. First, Excel tables have caused a lot of crashes in the past, and removing Excel from the mix here can prevent a lot of lost data. Second, not all companies use Excel, and those who do often use very old versions. Third, SolidWorks cannot provide enhancements to Excel functionality, especially old Excel functionality. The only way to get all of this was for the SolidWorks software designers to create their own internal tables, which has worked out pretty well. SolidWorks has also provided equivalent tools for design tables, so Excel is no longer a real requirement to get all the functionality out of SolidWorks.
Examining the SolidWorks Table-Based BOM
The BOM shown in Figure 29.1 is a default SolidWorks table-based BOM. The differences between the displays of the two types of BOMs are mainly cosmetic; the bigger difference is in the functionality. The PropertyManager interface for the SolidWorks BOM is shown in Figure 29.2.

FIGURE 29.2 The PropertyManager for a table-driven BOM
CREATING TABLE-BASED BOM TEMPLATES
Like other types of data, the SolidWorks table-driven BOM starts from a template. The BOM in Figure 29.1 was created from the default BOM template. When a BOM is initiated, you can select the template in the Table Template panel near the top of the PropertyManager, as shown in Figure 29.2.
You create table-based BOM templates in much the same way that you create other templates:
- Specify the settings.
- Delete the document-specific data.
- Save the template.
- Access the template from a library location.
To save the template, right-click the BOM and select Save As. In the Files Of Type drop-down list, select Template (*.sldbomtbt). (The extension sldbomtbt stands for SolidWorks Bill of Materials Table Template.) Any of the settings, additional columns, links to properties, and so on are saved to the template and reused when you create a new template from it.
SETTING A TABLE ANCHOR
A table anchor locks a corner of the table to a selected point on the drawing sheet format. If you do not select a point in the format, the table is placed at a corner of the sheet. To specify a point in the format to act as the anchor, you must be editing the format. Right-click the sheet and select Edit Sheet Format. Then right-click a sketch endpoint in the format, select Set As Anchor, and specify for which type of table the anchor is intended. You can set different anchor locations for different types of tables. Figure 29.3 shows the selection and menus for this option.

FIGURE 29.3 Setting a BOM table anchor
USING BOM TYPES
SolidWorks has three BOM types: Top-Level Only, Parts Only, and Indented. As the name suggests, the Top-Level Only BOM shows only components on the top level. It treats subassemblies as a single entry. As a result, if the top-level assembly shown on the drawing is made up of five subassemblies and two individual parts, and you select the Top-Level Only option; then only seven items will be shown in the BOM.
The Parts Only BOM ignores subassembly structure and displays only parts in an unindented list.
The Indented BOM shows the parts of subassemblies in an indented list under the name of the subassembly. This is the most complete list of SolidWorks documents used because it includes all parts and assemblies.
The Show Numbering option for indented assemblies is activated only after you have selected the Indented option and placed the table. When you use this option, it causes subassembly parts to be numbered with an X.Y number system. For example, if item number 4 is a subassembly and it has three parts, those parts are numbered 4.1, 4.2, and 4.3.
USING CONFIGURATIONS
The Configurations panel of the BOM PropertyManager displays slightly differently for Top-Level Only BOMs compared to the other types. The Top-Level Only BOM type enables the option to show multiple assembly configurations and display the quantities for top-level components in separate columns, as shown in Figure 29.4. This figure shows that the configuration named “simplified” has some suppressed parts.

FIGURE 29.4 Configuration options with the BOM
LOCATING THE KEEP MISSING ITEMS OPTION
When you are making changes to a model, parts are often either suppressed or deleted altogether. Some company documentation standards require that parts that are removed from a BOM remain on the bill and appear with strikethrough formatting.
Keep Missing Items and Zero Quantity Display have both been moved to the Tools ➢ Options ➢ Document Properties ➢ Detailing ➢ Tables screen.
CHOOSING ZERO QUANTITY DISPLAY OPTIONS
The Zero Quantity Display settings are used only for configurations where a component isn't used. These three options are available:
- Quantity Of Dash: Substitutes a dash for the quantity value
- Quantity Of Zero: Uses a zero for the quantity value
- Blank: Sets the quantity value to blank
ASSIGNING ITEM NUMBERS
Item numbers for components listed in the BOM can start at a specific number and be given a particular interval. The Do Not Change Item Numbers option means that even when rows are reordered, item numbers stay with their original components.
The Follow Assembly Order option, which is also available through the right mouse button (RMB) menu, means that the order of the components in the BOM follows the order of the components in the assembly FeatureManager. If the order is changed in the assembly, it also updates in the drawing.
EDITING THE BOM
The BOM contents can be changed on the BOM or through the RMB menu. Figure 29.5 shows a simple BOM with the RMB menu. For example, you can drag the row numbers to reorder BOM items and right-click to hide them. Row numbers are displayed only after you select the BOM table.
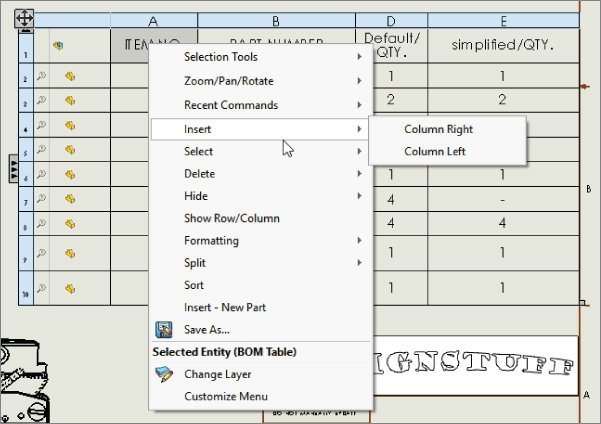
FIGURE 29.5 The BOM RMB interface
You can add columns or rows to the BOM for additional properties or manually added parts (such as items you wouldn't model, like paint or glue, although virtual components can also be used for this purpose). To change the property displayed in a column, double-click in the column header. In previous releases, many of the settings and options now found on the RMB menu were found in a more complex Bill of Materials Properties window. The newer arrangement is more intuitive. Most SolidWorks users know to try the RMB menu if they select something and don't find the option they are looking for in the PropertyManager.
CONTROLLING THE APPEARANCE OF THE TABLE-BASED BOM
To move the table, place the mouse over the BOM and notice the border that appears around it. Drag the crossed-arrows icon in the border to move the table. When you select the table, the border will remain, enabling you to move, reorder, RMB, or respace the cells. You can change the properties of a row or a column by selecting just outside of the row or column to the top or the left.
You can establish the spacing and width of rows or columns by dragging the border on the left side of the column with the split cursor or by accessing the Column Width setting through the Formatting option in the RMB menu.
While the selection is activated, you can also expand a panel to the left and another to the top by clicking the three small arrows in the selected BOM border. Figure 29.6 shows the left panel, called the Assembly Structure panel, expanded with the cursor pointing to the three small arrows. In addition to showing the assembly structure, this panel can also show which parts are ballooned on the drawing.
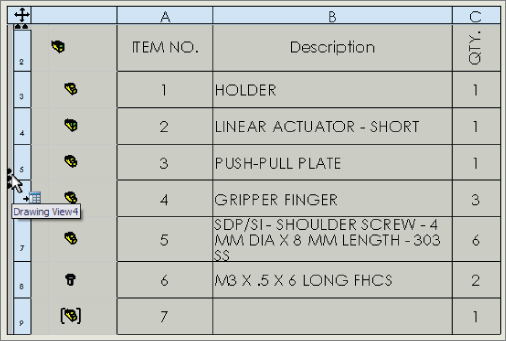
FIGURE 29.6 An expanded BOM border
Notice item 7 on the BOM, which has a different symbol and no name. This is a virtual component (a component created in context but not saved to its own document file); it exists only within the assembly.
DISSOLVING, COMBINING, NUMBERING, AND RESTRUCTURING FOR INDENTED BOMS
You can dissolve an assembly in the BOM. To do this, the BOM must show an indented list. You can then access the Dissolve option from the RMB menu on the Assembly icon. You can delete any restructuring you have done to the BOM by right-clicking the Assembly icon with red arrows and selecting Restore Restructured Components.
If the BOM shows several parts that are identical, and you would like to combine them, again, you can access the option from the RMB menu.
Item numbers in indented BOMs can be flat (such as 1, 2, 3), or they can be detailed (such as 1.1, 1.2, 1.3, 2, 2.1, 2.2) to reflect parts as members of subassemblies. This formatting option is available in the BOM Type panel in the BOM PropertyManager, under the Indented option.
ADDING COLUMNS OR ROWS
To add a column, right-click near where you want to add the column and choose Insert ➢ Column Right or Column Left. Inserting rows is exactly the same. The next thing you want to do with a column is to assign what kind of data goes into it. You can use a custom property such as Part Weight or Vendor, as shown in Figure 29.7. Access this interface by double-clicking a column header and selecting Custom Property from the drop-down list.
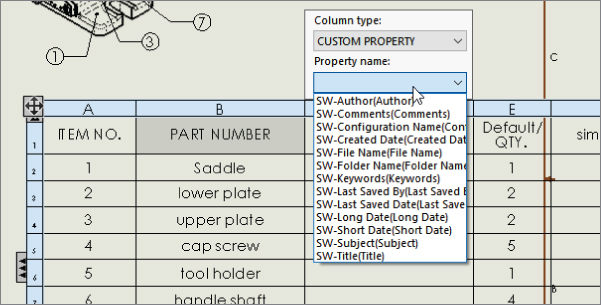
FIGURE 29.7 Establishing the property driving the column content
One of the really beautiful aspects of custom property management in the BOM is that if you just type text in a column that is set up to be driven by a part property, SolidWorks will automatically update the part with the property. If the property didn't exist in the part previously, SolidWorks also will create the property. You will need to select the Keep Link option in the popup when it is presented when editing a table in this way to preserve the associative link.
EDITING BOMS
When you need to manually enter text in a BOM, for example in general tables or custom properties in BOMs, you can use the Tab and arrow keys to move the cursor between cells.
Here's a summary of the Navigation functionality:
- Enter: Move to the next cell down.
- Tab: Move to the next cell to the right.
- Arrow: Move the cursor in any direction.
- Shift+Arrow: Increase the selection size.
- Shift+Tab: Move the cursor backward.
- Shift+Enter: Move the cursor up.
- Home: Move the cursor to the first column.
- Ctrl+Home: Move to the upper-left corner of table.
- End: In combination with the arrow keys, move to the end indicated.
- Ctrl+End: Move the cursor to the bottom-right corner of the table.
Here's a summary of the Editing functionality:
- F2: Edit the contents of cell.
- Double-click: Edit the contents of cell.
- Alt+Enter: Add multiple rows to the cell.
- Delete: Delete the contents of cell without activating cell.
- Backspace: Delete the contents of cell and activate cell.
- Ctrl+Delete: Delete one word at a time.
- Edit: Edit multiple row heights simultaneously.
- Lock: Lock the row height and column width.
- Copy: Copy cells from Excel to SolidWorks tables.
Retiring an Excel-Based BOM
![]() In previous releases, Excel-based BOMs were the only way to add a BOM to a drawing. This feature has been replaced in most respects by the SolidWorks native table-driven BOM, but many people still use the Excel-based BOM either out of habit or to comply with legacy standards. Figure 29.8 shows the interface for the Excel-based BOM.
In previous releases, Excel-based BOMs were the only way to add a BOM to a drawing. This feature has been replaced in most respects by the SolidWorks native table-driven BOM, but many people still use the Excel-based BOM either out of habit or to comply with legacy standards. Figure 29.8 shows the interface for the Excel-based BOM.

FIGURE 29.8 The interface for Excel-based BOMs
Using Design Tables
![]() Design tables that are used to drive the configurations of parts and assemblies can be shown on the drawing. This type of drawing is often called a tabulated drawing and is typical of parts that have a basic shape that is common among several sizes or versions of the part. The sizes are shown by a symbol on the drawing, with a column headed by that symbol showing the available dimensions and the corresponding size (configuration) names.
Design tables that are used to drive the configurations of parts and assemblies can be shown on the drawing. This type of drawing is often called a tabulated drawing and is typical of parts that have a basic shape that is common among several sizes or versions of the part. The sizes are shown by a symbol on the drawing, with a column headed by that symbol showing the available dimensions and the corresponding size (configuration) names.
You can insert a design table into a drawing by choosing Insert ➢ Tables ➢ Design Table or by clicking the Design Table button on the Tables toolbar. In either case, you must preselect a drawing view of a part or assembly that contains a design table before the menu selection or toolbar button becomes activated.
Design tables that are displayed in this way are often formatted to some extent. You need to hide columns and rows unless you want the dimension or feature name syntax to display on the drawing as well as the values. Extra columns and rows are often added to make the design table readable.
Figure 29.9 shows the drawing with the table inserted. To display the table properly, you must edit the table in the window of the parent document and adjust the border of the table to be exactly how you want it to appear on the drawing. The adjusted table is shown in Figure 29.9.
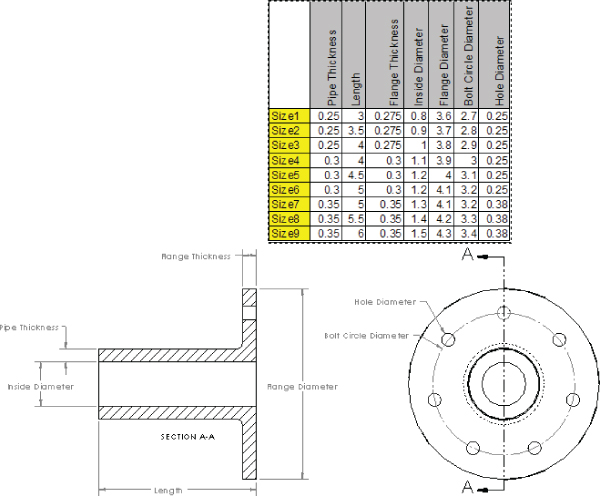
FIGURE 29.9 A drawing with the design table inserted
The labeled dimensions are created by simply making reference dimensions and overwriting the <DIM> value in the Dimension Text panel of the Dimension PropertyManager. If you want to examine this data more closely, the drawing and part are included in the download materials on the Wiley website. The drawing is named DT.slddrw.
This drawing uses a part design table, but you can also place assembly design tables onto the drawing. This is often called a tabulated detail drawing.
If you need to place something on your drawing such as a design table, but it doesn't appear that the design table will meet your needs, you can simply copy the data out of the design table and re-create it in a static Excel spreadsheet. The design table that you place on the drawing will update if it's changed in the part or assembly, just like the drawing geometry, but you must manually update an Excel spreadsheet that's created from copied data. Keep in mind that you must decide whether the automatic functions are worth the time you invest in setting them up. In many cases, they are; in other cases, they require more work than they save.
Placing Hole Tables on Drawings
![]() You can place hole tables on drawings to include information such as the size, position, and the number of holes or slots of a given size on a drawing. Only circular holes, slots, and blind slots and counterbore slots with chamfers that were created with the Hole Wizard are recognized. You don't have to use the Hole Wizard or simple hole features to make the holes. The position is given relative to a selected reference position, and the holes are labeled. You shouldn't use a hole table for slots unless you first test to make sure you're getting correct data.
You can place hole tables on drawings to include information such as the size, position, and the number of holes or slots of a given size on a drawing. Only circular holes, slots, and blind slots and counterbore slots with chamfers that were created with the Hole Wizard are recognized. You don't have to use the Hole Wizard or simple hole features to make the holes. The position is given relative to a selected reference position, and the holes are labeled. You shouldn't use a hole table for slots unless you first test to make sure you're getting correct data.
Like other table types, hole tables can use templates. As with other templates, you should store Hole Table templates in a library area outside of your local SolidWorks installation folder. You can then direct SolidWorks to this location by choosing Tools ➢ Options ➢ File Locations and specifying the path settings.
Hole tables use anchors in exactly the same way as BOMs. For more information, see the section on table anchors earlier in this chapter.
You can find the options for hole tables by choosing Tools ➢ Options ➢ Document Properties ➢ Drafting Standard ➢ Tables ➢ Hole.
Figure 29.10 shows the PropertyManager for a hole table. The left image shows the PropertyManager that appears when you create the table, and the right image shows the one that appears when you edit the table. Figure 29.11 shows the resulting hole table on a drawing with a part that contains holes. The table incorporates holes from multiple views, using a different zero reference for each view.

FIGURE 29.10 The PropertyManager for the hole table
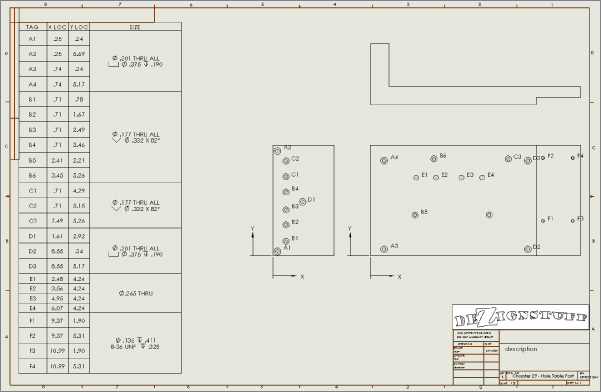
FIGURE 29.11 A hole table combining holes in different views
To initiate the Hole Table function, click Insert ➢ Table ➢ Hole Table.
To specify the datum, either select an edge in each direction to serve as the zero mark for the X and Y directions or select a vertex or point to serve as the origin in both directions.
To select the holes to be included in the table, activate the selection box in the Holes panel, and either select the hole edges directly or select the faces on which the holes are located. After you place the table, you can add holes or change the datum information. To do this, right-click the Hole Table entry in the Drawing FeatureManager and select Edit Feature. You can resize columns and rows in the same way as for BOM tables.
In the table in Figure 29.11, the Combine Same Sizes option is used, which causes several of the cells in the table to merge. This option is available from the RMB menu for the table. If you use the Combine Same Tags option, then the hole locations are not displayed—only the hole callout description and the quantity appear
You can control the hole callout description by using the file named calloutformat.txt, which is found in the langenglish subdirectory of the SolidWorks installation directory. Again, if you customize this file, you should keep it in a library external to the installation directory and list it in the Tools ➢ Options ➢ File Locations area. This text file enables you to define how hole callouts are specified for different types of holes.
Using Revision Tables
![]() The revision table uses a table anchor in exactly the same way as the BOM table. Revision tables also use templates in the same way as the other table types, and you should move customized templates to a library location and specify the location in Tools ➢ Options ➢ File Locations.
The revision table uses a table anchor in exactly the same way as the BOM table. Revision tables also use templates in the same way as the other table types, and you should move customized templates to a library location and specify the location in Tools ➢ Options ➢ File Locations.
Figure 29.12 shows the Revision Table PropertyManager interface where you can create and control the settings for the table. You can find the default settings for revision tables by choosing Tools ➢ Options ➢ Document Properties ➢ Drafting Standard ➢ Tables ➢ Revision.

FIGURE 29.12 The Revision Table PropertyManager interface
You can initiate the Revision Table function through the menus or the Tables toolbar. However, this function simply creates the table; it does not populate it. SolidWorks File Management, which is not covered by this book, can be used to help you automatically fill in the revision table as revisions are created.
You must set the table anchor in the drawing format in order for the table anchor to work. You can add or format additional columns to accept other data. After you have created the columns or formatting, you can save the changes to a template, which is also available through the RMB menu.
You can manually add a revision to the table by right-clicking the table and choosing Revisions ➢ Add Revision. This includes control over whether the revision uses numerical or alphabetical revision levels, but it doesn't provide for more complex revisioning schemes.
Immediately after you have created the revision, if the option is enabled, you will be prompted to place a balloon that contains the revision level to identify what has been changed. To finish placing symbols, you can press Esc. When you are finished placing the balloons, you can fill in the description of the revision by double-clicking in the Description cell where you want to add text. Figure 29.13 shows a revision table with balloon symbols placed on the drawing.

FIGURE 29.13 A revision table with balloon symbols
Revision tables work by creating a Revision custom property in the drawing document and by incrementing this revision each time a revision is added to the table. You can add more columns linked to custom properties to revision tables and Revision Table templates.
Using General Tables
![]() You can use general tables for any type of tabulated data. Column headers can be filled with either text labels or custom property links. You can also use regular Excel OLE objects for the same purpose, and depending on the application, you may prefer to use them.
You can use general tables for any type of tabulated data. Column headers can be filled with either text labels or custom property links. You can also use regular Excel OLE objects for the same purpose, and depending on the application, you may prefer to use them.
The general table uses the filename extension *.sldtbt. You can create it without a template, as a simple block of four empty cells, or you can use a template that has a set of pre-created headers.
Working with Tables in Models
Proponents of solid modeling have been saying for years that 2D drawings are going to disappear. However, not everyone is convinced. Paper drawings will continue to be useful until all old manufacturing methods are abandoned, and this probably won't happen in your lifetime.
However, because some companies rely less on 2D and paper drawings, the industry is developing new ways to create 2D type documentation inside a 3D document. The ASME Y14.41 standard deals primarily with this transition.
SolidWorks is responding to this type of requirement by adding features that enable you to document the 3D data. Placing BOMs in assembly files is one way of doing this. Placing 2D type data into 3D model documents can reduce the need for paper or even electronic 2D documentation. Figure 29.14 shows a BOM inside an assembly model document.
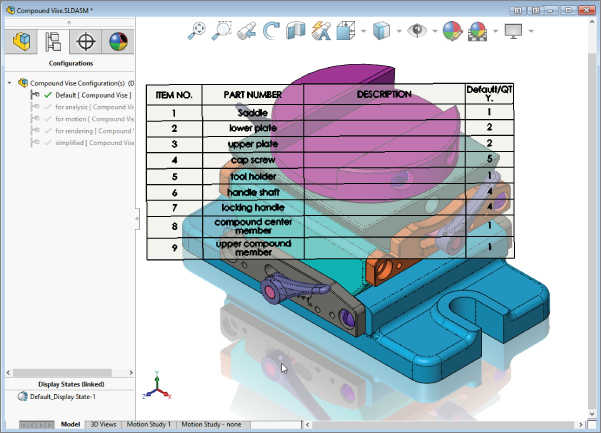
FIGURE 29.14 Displaying BOM data inside an assembly document
Matching the relative scale of the table to the model can be difficult. To do this, you must adjust the zoom state of the model until it's fairly small within the screen and then place the table. After you place the table, the assembly and the table will zoom together. Most users avoid this issue by viewing the table in a separate window. Alternatively, you can use the BOM Scaling box in the Bill of Materials PropertyManager that enables you to scale the BOM without using the previous method, although the previous method still works.
Items like the BOM can be placed in a Notes Area, which is defined by right-clicking on the Notes folder in the FeatureManager.
Another type of table that you can use within a 3D model document is the title block table, which can be used inside parts and assemblies. You can use title block tables in the drawing to fill in information about the part or assembly and at the same time avoid creating a full 2D drawing.
Tutorial: Using BOMs
Rather than having tutorials for every table type, this chapter has tutorials only for the BOM, hole table, and revision table. You can transfer the skills you use with these types to the other types.
This tutorial will guide you through the steps to prepare an assembly for the drawing and BOM. Configurations and custom properties are used in this example. Remember that if a drawing view is cross-hatched and you cannot see the geometry, you may have to press Ctrl+Q to rebuild it. Follow these steps:
- Begin this tutorial with SolidWorks closed and Windows Explorer open.
- If you have not already done so, create a folder for a library that's not in your SolidWorks installation folder. Call it
D:Libraryor something similar. Make a folder inside this folder calledDrawing Templates. Copy the files from the Chapter 29 download materials namedinch B.drwdotandinch B (no views).drwdotto this new folder. - Launch SolidWorks and choose Tools ➢ Options ➢ File Locations ➢ Document Template. Click the Add button and add the new library path to the list. Shut down SolidWorks and restart it.
- Open the assembly
BOM Assy.sldasmfrom the Chapter 29 download materials. - Click the Make Drawing From Part/Assembly button (or select from the File menu), and make a new drawing of the assembly from the drawing template in the folder created in steps 2 and 3.
- Delete the isometric view. Create a new view using the configuration Angle 1 and show it in the exploded state. Use the settings shown in Figure 29.16.
- Edit the sheet format. Right-click the sketch point at the location indicated in Figure 29.15. In the pop-up menu that appears, select Set As Anchor and then select Bill Of Materials.

FIGURE 29.15 Setting the table anchor
- Exit Edit Sheet Format mode by selecting Edit Sheet from the RMB menu.
- Select the new view and show it in the exploded state (right-click and select Properties ➢ Show In Exploded State). Then choose Insert ➢ Table ➢ Bill Of Materials or click the Bill Of Materials button in the Tables toolbar. Select the Attach To Anchor Point option, and show both configurations Angle 1 and Angle 2 in the BOM, as shown in Figure 29.16.

FIGURE 29.16 Creating an exploded view and the Bill of Materials
- Click inside the exploded view, but not on any part geometry, and then select the Autoballoon tool from the Annotations toolbar. Toggle through the available options to see whether any of the possible autoballoon configurations meet your needs. If not, use the standard Balloon tool to select the part and place the balloon. This gives you more control over the attachment points and placement of the balloons.
- Change the balloon for the short pin to be a circular split-line balloon; do this by clicking the balloon and switching the style in the PropertyManager. Notice that the quantity appears in the bottom of the balloon. The drawing view and the BOM should look like Figure 29.17.

FIGURE 29.17 The drawing view and the BOM after step 11
Add a second leader to the balloon for the short pin by Ctrl+dragging the attachment point for the first leader from one pin to the other.
- Notice that several of the parts use a default description of “description.” Edit each of these parts by double-clicking in the Description field for the part you want to change and changing the value right in the BOM table. This will update the part itself automatically.
- The Bracket part is listed twice using the configuration name because of the way the configurations are set up for the parts.
Notice also that the Description field holds the configuration-specific custom property for Description, which is used in the BOM. To list the bracket only once using the filename, open the bracket, right-click one of the configuration names in the ConfigurationManager, and select Properties. In the Bill Of Materials Options panel, select Document Name from the drop-down list. Do this for the other configuration as well.
- Notice also that the Description field holds the configuration-specific custom property for Description, which is used in the the BOM. Toggle back to the drawing (press Ctrl+Tab), select anywhere on the BOM table, and then select Table Properties from the PropertyManager. Expand the Part Configuration Grouping panel, and select the option Display All Configurations Of The Same Part As One Item. This changes how the bracket displays, as well as the pins.
- Now add a column to the BOM that calls on an existing custom property that's already in all the parts. Place the cursor over the last column on the right, and right-click it. Choose Insert ➢ Column Right. This places a new column to the right of the last one and displays a pop-up menu that enables you to set the column to be driven by a custom property, as shown in Figure 29.18.

FIGURE 29.18 Adding a column to the BOM
- In the first drop-down selection box, select the Weight custom property. Click the green checkmark icon to accept the changes. If the pop-up menu disappears and you need to get it back, double-click the column header to redisplay it.
- You can save the BOM with the additional column as a BOM template by right-clicking anywhere in the BOM and selecting Save As. You can then set the type to a BOM template and the directory to the library location for BOM templates.
If you want to compare your results against those in this example, check the finished drawing, which is called BOM Tutorial Finished.slddrw.
Tutorial: Using Hole Tables
This tutorial guides you through creating and changing settings that are common in SolidWorks hole tables. Follow these steps:
- Create a new drawing from the
inch B (no views).drwdottemplate. If you haven't created the BOM tutorial, move the drawing template namedinchB.drwdotfrom the download materials to your library location for drawing templates. Then create the drawing from the template. - Click the Model View button on the Drawings toolbar and browse to the part named
Hole Table Part.sldprt. - Place a front view and project a left view and an isometric view. Then press Esc to quit the command. Finally, delete the four predefined views.
- No anchor exists in this template for a hole table, so if you want to create one, do this now. Follow the steps in the BOM tutorial for specifying the anchor point.
- Click the Hole Table button in the Tables toolbar. Figure 29.19 shows a section of the Hole Table PropertyManager with the selections that you need to make for this hole table.
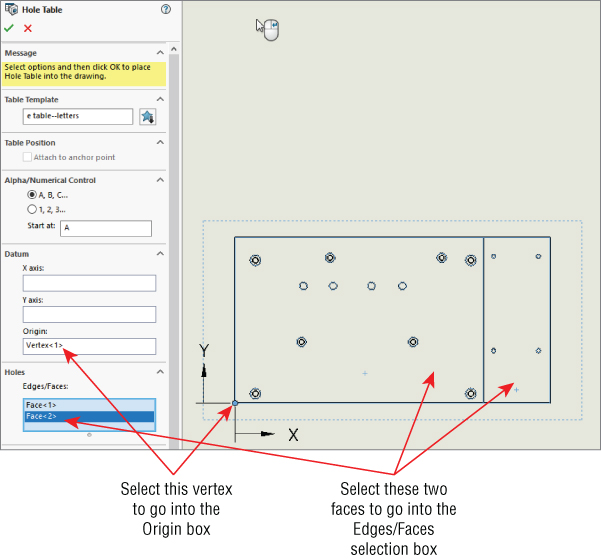
FIGURE 29.19 The Hole Table PropertyManager and selections
- After you have completed the selections, click the Next View button at the bottom of the PropertyManager and make similar selections in the left view. The holes for both views are added to a single hole table. The table is created using the default settings established in Tools ➢ Options ➢ Document Properties ➢ Tables, but you can change them here for this specific table.
- Click anywhere in the table, and then select Table Properties at the bottom of the PropertyManager. Changing from numerical to alphabetical assigns a letter to each hole type and a number to each instance of the type. Make this change and update the table. Figure 29.20 shows the table before and after the changes.
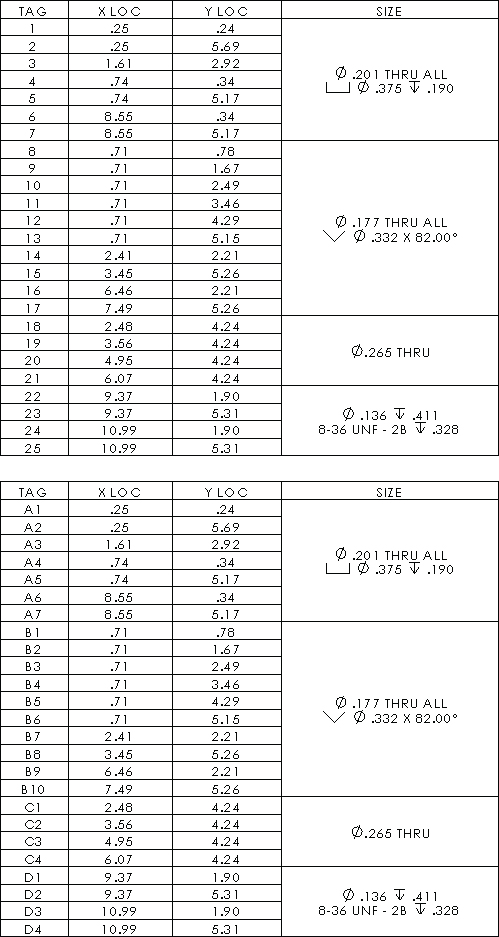
FIGURE 29.20 Using numerical and alphabetical hole tag identification
- Change the number of decimal places used in the hole table from two places to three. You can do this in the PropertyManager.
- Deselect the Hide Hole Centers option in the Visibility panel.
- Select the Combine Same Sizes option in the PropertyManager.
- Save the drawing.
Tutorial: Using Revision Tables
In this tutorial, you will create a basic revision table and make a template. Follow these steps:
- Using a drawing that you completed in one of the previous tutorials, make sure that a Revision Table anchor has been placed in the upper-right corner of the sheet format. You must edit the sheet format to do this, by right-clicking the point that you want to use for the anchor. Remember to select Edit Sheet from the RMB menu to exit Edit Sheet Format mode.
- Click the Revision Table button on the Tables toolbar. Select the Attach To Anchor option in the PropertyManager. Click the green checkmark icon to accept the table. Figure 29.21 shows the initial stub of the revision table.
FIGURE 29.21 The initial stub of the revision table
- To initiate a new revision level in the Revision Table, right-click the table and choose Revisions ➢ Add Revision.
Depending on the default settings in Tools ➢ Options ➢ Document Properties ➢ Drafting Standard ➢ Tables ➢ Revision, the first revision will be either A or 1. If you are using PDMWorks Workgroup, you may have other options.
Depending on your options settings, you may immediately be prompted to place a balloon that contains the new revision level. You can place balloons with or without leaders. The balloons are meant to indicate areas of the drawing that are affected by the revision. Press Esc when you are finished placing the balloons.
- To add text to the Description field, simply click in the field and start typing. The text will automatically wrap to fit the box.
- Practice by adding a couple of revisions, balloons, and descriptions.
- After you have added a couple of revisions, check the custom properties by choosing File ➢ Properties ➢ Custom. Notice that a revision property has been added, and the latest revision is represented by the value of the custom property.
- Add columns in the same way that you added them to the BOM. You can merge and unmerge cells, and link properties to cells. With the cursor over the last column (Approved), right-click and choose Insert ➢ Column Left. In the Column Properties, select Custom, and from the Properties drop-down menu, select DrawnBy. Accept the changes by clicking the green checkmark icon.
- Save the template by right-clicking anywhere in the revision table and choosing Save As ➢ Rev Table Templates. Then save the template to the appropriate location outside the SolidWorks installation directory.
The Bottom Line
SolidWorks enables you to work with tables that are highly specialized for particular uses and with general tables that are available for any type of tabulated data. The most frequently used types are BOMs, hole tables, and revision tables. Design tables that drive part and assembly configurations can also be placed on a 2D drawing, but in these cases, some formatting is usually necessary to make these tables presentable and the information on it easy to read.
- Master It Go through all of your drawing templates with formats, and all of your separate formats, and make sure that you have anchors for all of the table types your company creates.
- Master It Take an existing assembly drawing, add a column to it, add a property, and fill out the property values in the table.
- Master It Make sure the assembly has an exploded view, and make one view on the drawing show that explosion. Next, add balloons to the view, using at least two circular split-line balloons that show the item number as well as another value, such as the quantity, the weight, or a custom property value.