
You view and work with information in Microsoft Project by selecting a specific view to be displayed in your Microsoft Project workspace. Of the many views built into Microsoft Project, some have to do with tasks, others with resources, and still others with assignments. Certain views are a spreadsheet of tables and columns. Others are graphs or forms. Other views are a blend, for example, the Gantt Chart includes both a sheet and a graph.
You can switch tables in a view, and add and remove fields shown in a view, and so modify these views to present your project information exactly the way you need.
When you first start using Microsoft Project, typically the first view you use is the Gantt Chart, which is the default view. Here, you enter information such as tasks, durations, and task relationships. Then you might use the Resource Sheet, in which you enter resource information. As you continue to plan your project, your requirements become more sophisticated, and you find you need other views. For example, you might want to see all your tasks with their current percent complete, along with the critical path. Or you might need a graph showing a particular resource’s workload throughout April and May.
Note
To change the view that opens when you first open Microsoft Project and create a new project file, click Tools, Options and then click the View tab. In the Default View box, click the view you want to appear by default whenever you create a new project file.
This setting changes the view only for any new project files. For an existing project file, the last view shown when you saved and closed the file is the one that appears when you open it again.
Note
For more information about other view options, see the section titled Arranging Your Microsoft Project Window later in this chapter.
The most commonly used views are available on the View menu. All views are available on the More Views submenu. To switch to a different view, do the following:
Click View and then look for the view you want.
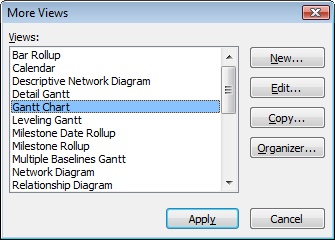
If the view you want is listed, click its name. If the view is not listed, click More Views. The full list of available Microsoft Project views appears (see Figure 4-2).
Double-click the view you want. It appears in your Microsoft Project workspace, replacing the previous view.
Keep in mind that when you switch from one view to another, you’re not changing the data; you’re just getting a different look at the data in your project database.
If you display the View bar, you can use it to quickly switch views. To show the View bar, do the following:
Click View, View Bar.
The View bar appears on the far left edge of the Microsoft Project window (see Figure 4-3). The same views that appear on the View menu are listed on the View bar.
Click a view’s name or icon to switch to that view. If you can’t see the view’s name, click the arrow at the bottom of the list to see more views.
If the view isn’t listed on the View bar, click More Views to see the full list.
Note
To hide a showing View bar, click View, View Bar. When the View bar is hidden, a blue vertical bar appears on the right edge of the current view. This is the Active View bar, and it shows the name of the current view. To change the current view, right-click the Active View bar. If the view you want appears in the shortcut menu, click it. Otherwise, click More Views to display the More Views dialog box and then click the view you want.
You can think of Microsoft Project views in the following categories:
Gantt charts
Network diagrams
Graph views
Sheet views
Usage views
Forms
Combination views
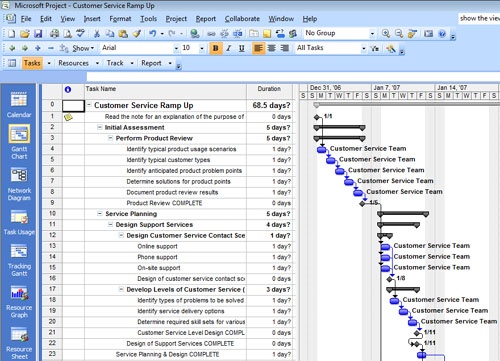
Gantt charts are a special type of view used extensively in project management. The left side of a Gantt chart contains a sheet view and the right side contains a bar graph along a timescale (see Figure 4-4).
Figure 4-4. A Gantt chart shows task information in the sheet portion of the view; the corresponding bar graph shows the task’s duration, start and finish dates, and task relationships.
While you can create custom Gantt charts, Table 4-1 describes the Microsoft Project Gantt charts that are built in to Microsoft Project.
Table 4-1. Microsoft Project Gantt Charts
Type of Gantt Chart | How you can use it | For more information |
|---|---|---|
Bar Rollup (task view) | View summary tasks with labels for all subtasks. Use the Bar Rollup view with the Rollup_Formatting macro to see all tasks concisely labeled on summary Gantt bars. | |
Detail Gantt (task view) | View tasks and associated information in a sheet and see slack and slippage for tasks over time in a bar graph on a timescale. Use the Detail Gantt to check how far a task can slip without affecting other tasks. | |
Gantt Chart (task view) | View tasks and associated information in a sheet and see tasks and durations over time in a bar graph on a timescale. Use the Gantt Chart to enter and schedule a list of tasks. This is the view that appears by default when you first start Microsoft Project. | |
Leveling Gantt (task view) | View tasks, task delays, and slack in a sheet, and the before-and-after effects of the Microsoft Project leveling feature. Use the Leveling Gantt to check the amount of task delay caused by leveling. | |
Milestone Date Rollup (task view) | View summary tasks with labels for all subtasks. Use the Milestone Date Rollup view with the Rollup_Formatting macro to see all tasks concisely labeled with milestone marks and dates on summary Gantt bars. | |
Milestone Rollup (task view) | View summary tasks with labels for all subtasks. Use the Milestone Rollup view with the Rollup_Formatting macro to see all tasks concisely labeled with milestone marks on the summary Gantt bars. | |
Multiple Baselines Gantt (task view) | View different colored Gantt bars for the first three baselines (Baseline, Baseline1, and Baseline2) on summary tasks and subtasks in the chart portion of the view. Use the Multiple Baselines Gantt to review and compare the first three baselines you set for your project. | Saving Original Plan Information Using a Baseline in Chapter 10 |
PA_Expected Gantt (task view) | View your schedule’s expected scenario based on durations calculated from a PERT analysis. | |
PA_Optimistic Gantt (task view) | View your schedule’s best-case scenario based on durations calculated from a PERT analysis. | |
PA_Pessimistic Gantt (task view) | View your schedule’s worst-case scenario, based on durations calculated from a PERT analysis. | |
Tracking Gantt (task view) | View tasks and task information in a sheet, and a chart showing a baseline and scheduled Gantt bars for each task. Use the Tracking Gantt to compare the baseline schedule with the actual schedule. |
You can change the look and content of bars on a Gantt chart. You can:
Change the pattern, color, and shape of the Gantt bar for a selected task.
Change the text accompanying the Gantt bar for a selected task.
Change the format and text for all Gantt bars of a particular type.
Change the text style for all Gantt bars of a particular type.
Change the layout of links and bars on a Gantt chart.
Change the gridlines in the view.
Troubleshooting
You can’t find the PERT analysis views
If you haven’t used PERT (program evaluation and review technique) analysis since installing Microsoft Project 2007, you might not see the PA_Expected Gantt, PA_Optimistic Gantt, PA_Pessimistic Gantt, or PA_PERT Entry Sheet in the More Views dialog box. These views do not appear in the More Views dialog box until you select it on the PERT Analysis toolbar.
To do this, click View, Toolbars, PERT Analysis. On the PERT Analysis toolbar (see Figure 4-5), click the button for the PERT analysis view (for example, Optimistic Gantt) you need. From this point forward, that PERT analysis view is listed in the More Views dialog box.
Note
For more information about changing the look and content of Gantt bars, see the section titled Formatting a Gantt Chart View in Chapter 25. To change the timescale in a Gantt Chart, see the section titled Working with Timescales later in this chapter. You can also change the content or look of the sheet portion of a Gantt chart. For details, see the section titled Customizing Views in Chapter 25. You can print views with the content and format you set up in the Microsoft Project window. For more information, see the section titled Setting Up and Printing Views in Chapter 12.
Network diagrams are a special type of graph view that presents each task and associated task information in a separate box, or node. The nodes are connected by lines that represent task relationships. The resulting diagram is a flowchart of the project. Network Diagram views (see Figure 4-6) are also referred to as PERT charts.
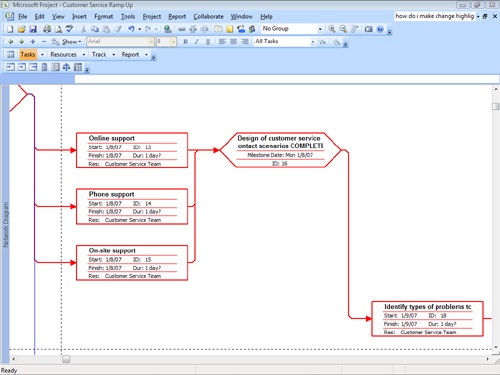
Figure 4-6. You can enter, edit, and review tasks and their dependencies in the Network Diagram view.
Table 4-2 describes the Microsoft Project network diagram views.
Table 4-2. Microsoft Project Network Diagram Views
Type of network diagram | How you can use it | For more information |
|---|---|---|
Descriptive Network Diagram (task view) | View all tasks and task dependencies. Use the Descriptive Network Diagram to create and fine-tune your schedule in a flowchart format. This view is similar to the regular Network Diagram, but the nodes are larger and provide more detail. | |
Network Diagram (task view) | Enter, edit, and review all tasks and task dependencies. Use the Network Diagram to create and fine-tune your schedule in a flowchart format. | |
Relationship Diagram (task view) | View the predecessors and successors of a single selected task. In a large project or any project with more complex task linking, use this task view to focus on the task dependencies of a specific task. |
Note
To learn about modifying the content or format of a network diagram, see the section titled Modifying a Network Diagram in Chapter 25.
Graph views present project information in a pictorial representation that more readily communicates the data (see Figure 4-7).
Table 4-3 describes the Microsoft Project graph views.
Table 4-3. Microsoft Project Graph Views
Type of graph view | How you can use it | For more information |
|---|---|---|
Calendar (task view) | View tasks and durations for a specific week or range of weeks in a monthly calendar format (see Figure 4-8). | |
Resource Graph (resource view) | View resource allocation, cost, or work over time for a single resource or group of resources at a time. Information is displayed in a column graph format (refer to Figure 4-7). When used in combination with other views, the Resource Graph can be very useful for finding resource overallocations. |
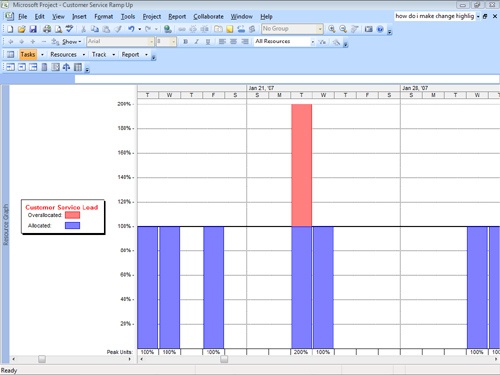
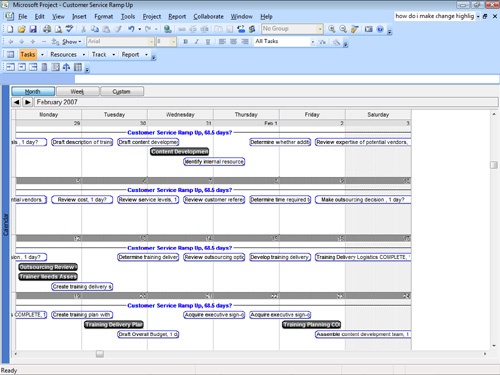
Figure 4-8. In the Calendar view, you can quickly see which tasks are scheduled on particular days, weeks, or months.
The Resource Graph shows peak units by resource, including the percentage of allocation and overallocation. You can change the type of information being shown in the Resource Graph by doing the following:
With the Resource Graph showing, click Format, Details.
The Details submenu lists the various categories of information that the Resource Graph can chart, including Work, Percent Allocation, and Cost.
Click the category of information you want charted on the Resource Graph.
Note
For information about modifying the format of the Resource Graph or Calendar view, see the section titled Customizing Views in Chapter 25.
Sheet views are spreadsheet-type views that are divided into columns and rows, and in which each individual field is contained in a cell (see Figure 4-9).
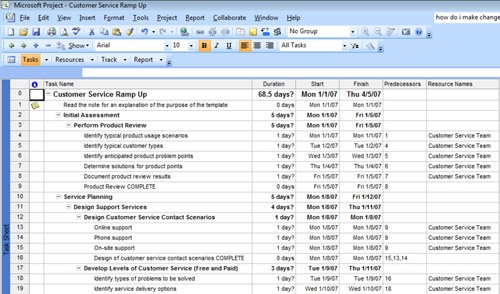
Figure 4-9. Use the Task Sheet to enter tasks and durations, and to review calculated start and finish dates.
The Microsoft Project sheet views are described in Table 4-4.
Table 4-4. Microsoft Project Sheet Views
How you can use it | For more information | |
|---|---|---|
PA_PERT Entry Sheet (task view) | Enter your schedule’s best-case, expected-case, and worst-case scenarios for a task’s duration in preparation of calculating the most probable duration using a PERT analysis, which helps you consider and reconcile disparities between different task estimates. | |
Resource Sheet (resource view) | Enter, edit, and review resource information in a spreadsheet format. | |
Task Sheet (task view) | Enter, edit, and review task information in a spreadsheet format. |
Note
For information about modifying the content or format of a sheet view, see the section titled Modifying a Sheet View in Chapter 25.
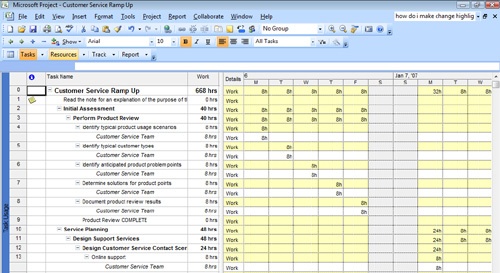
Usage views are made up of a sheet view on the left side and a timesheet on the right. Together with the timescale, the timesheet can show work, cost, availability, and other data broken out by time, that is, timephased (see Figure 4-10).
The Microsoft Project usage views are described in Table 4-5.
Table 4-5. Microsoft Project Usage Views
Type of usage view | How you can use it | For more information |
|---|---|---|
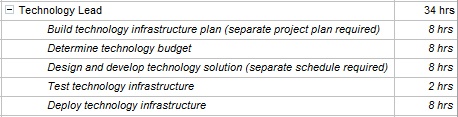
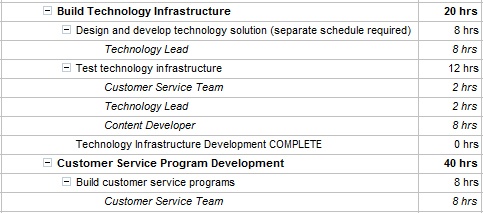
Resource Usage (assignment view) | Review, enter, and edit assignments by resource. In the sheet portion of the Resource Usage view, each resource is listed with all associated task assignments indented beneath it (see Figure 4-11). In the timesheet portion of the view, information such as work or costs for the resource and the assignment is listed according to the timescale, for example, by week or month. | |
Task Usage (assignment view) | Review, enter, and edit assignments by task. In the sheet portion of the Task Usage view, each task is listed with the assigned resources indented beneath it (see Figure 4-12). In the timesheet portion of the view, information such as work or costs for the task and the assignment is listed according to the timescale, for example, by day or by week. |
Because the timesheet portion of the usage views breaks down information from certain fields and from specific time periods, there are three subcategories to the major field categories of tasks, resources, and assignments:
Task-timephased
Resource-timephased
Assignment-timephased
You can review task-timephased and assignment-timephased fields in the timesheet portion of the Task Usage view. You can review resource-timephased and assignment-timephased fields in the timesheet portion of the Resource Usage view.
Note
Timephased information is used in many earned-value analysis calculations. For more information about earned value, see Chapter 13.
The Work field is shown by default in the timephased fields in the timesheet portion of a usage view. Multiple fields of information can be "stacked" in the view at one time. To change the type of information shown, do the following:
With a usage view showing, click Format, Details.
The Details submenu lists the different timephased fields that the timesheet portion of the usage view can display, for example, Actual Work, Baseline Work, and Cost. Any fields currently displayed are noted with a check mark.
Click the field you want to add to the timesheet. Another row of timephased information is added to the timesheet for each task.
To remove a row of information from the timesheet, click Format, Details and then click the item you want to remove.
Note
For information about modifying the format of a usage view, see the section titled Modifying a Usage View in Chapter 25.
Forms are specialized views that include text boxes and grids in which you can enter and review information in a way similar to a dialog box (see Figure 4-13). Although you can display a form on its own and click the Previous and Next buttons to cycle through the different tasks or resources in your project, a form is most useful when included as part of a combination view (see Working with Combination Views in the next section).
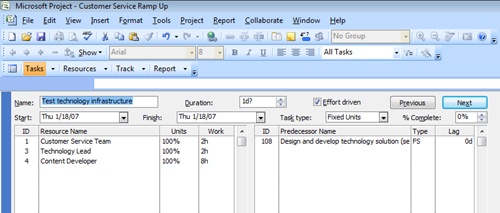
Figure 4-13. This Task Form shows fundamental information about the task, along with information about assigned resources and predecessor tasks.
The Microsoft Project forms are described in Table 4-6.
Table 4-6. Microsoft Project Forms
Type of form | How you can use it | For more information |
|---|---|---|
Resource Form (resource view) | Enter, edit, and review all resource, task, and schedule information about a selected resource, one resource at a time. The grid area can show information about the resource’s schedule, cost, or work on assigned tasks. It is most useful when used as part of a combination view (see Figure 4-14). | |
Resource Name Form (resource view) | Enter, edit, and review the selected resource’s schedule, cost, or work on assigned tasks. The Resource Name Form is a simplified version of the Resource Form. | |
Task Details Form (task view) | Enter, edit, and review detailed tracking and scheduling information about a selected task, one task at a time. The grid area can show information about assigned resources, predecessors, and successors. | |
Task Form (task view) | Enter, edit, and review information about a selected task, one task at a time. The grid area can show information about the task’s assigned resources, predecessors, and successors. | |
Task Name Form (task view) | Enter, edit, and review the selected task’s assigned resources, predecessors, and successors. The Task Name Form is a simplified version of the Task Form. |
You can change the categories of information shown in a form view. To do this, follow these steps:
Click View, More Views. In the More Views dialog box, click the form you want. Click the Apply button.
Right-click the blank area on the form. A shortcut menu appears, which shows different types of information that can be shown in the form. A check mark appears next to the information currently shown in the form.
Click the information you want to display in the form. You can choose only one item from the shortcut menu at a time.
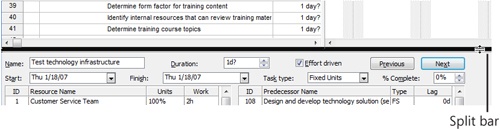
Combination views are groupings of two views in a split screen. The information in one portion of the split screen controls the content in the other portion (see Figure 4-14).

Figure 4-14. When you click a task in the upper Gantt Chart portion of the Task Entry view, the task, assignment, and predecessor information for that selected task appear in the lower Task Form portion of the view.
The predefined Microsoft Project combination views are described in Table 4-7.
Table 4-7. Microsoft Project Combination Views
Type of combination view | How you can use it | For more information |
|---|---|---|
Task Entry (task view) | Enter, edit, and review detailed information about the task selected in the Gantt Chart. The Gantt Chart appears in the upper portion of the view, and the Task Form appears in the lower portion. The information shown in the Task Form corresponds with the task selected in the Gantt Chart. | |
Resource Allocation (resource view) | Review and resolve resource overallocations. The Resource Usage view appears in the upper portion of the view, and the Leveling Gantt appears in the lower portion. The information shown in the Leveling Gantt corresponds with the resource or assignment selected in the Resource Usage view. |
You can create your own combination view by simply splitting the view. For example, if you split the Gantt Chart view, the Task Form appears in the lower pane, instantly resulting in the Task Entry view. Likewise, if you split the Resource Sheet, the Resource Form appears in the lower pane.
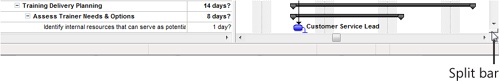
The split bar is located in the lower-right corner of the Microsoft Project window, just below the vertical scroll bar. To split a view, drag the split bar up to about the middle of the view or wherever you want the split to occur. Or click Window, Split.
To remove the split and return to a single view, double-click the split bar, which is now the gray dividing bar between the two views. Or click Window, Remove Split.
To modify a combination view, simply modify one component of the combination view as if it were in its own view.
Note
For more information about combination views, see the section titled Customizing Views in Chapter 25.
Many Microsoft Project views, including Gantt charts and usage views, use a timescale to indicate time in the project. The timescale appears above the chart or timesheet area of a view. You can display up to three timescales (see Figure 4-15), each timescale in a tier. The highest tier shows the broadest period of time, and the lowest tier shows the most detailed period of time. For example, you can show days within weeks within months, or you can show weeks within quarters.

The default timescale is two tiers: days within weeks. To set your timescale options, do the following:
Show a view that contains a timescale, for example, the Gantt Chart, Task Usage view, or Resource Graph.
Click Format, Timescale. The Timescale dialog box appears.
The Timescale dialog box has four tabs: Top Tier, Middle Tier, Bottom Tier, and Non-Working Time. The Middle Tier tab is displayed by default. In the Show box, click the number of timescale tiers you want to display (one, two, or three).
In the Units box, specify the time unit you want to display at the middle tier, for example, quarters, months, or weeks.
In the Label box, click the format in which you want to display the time unit, for example, January 27, Jan 27, Sun 27, and so on. If necessary, scroll to see more time unit formats to find the one you want.
If you chose to display more than one tier, click the Top Tier and/or Bottom Tier tabs and repeat steps 4 and 5.
Any sheet view, including the sheet portion of any Gantt chart or usage view, has a default table defined for it. You can change the table for these types of views. Or you can modify an existing table to add, change, or remove the fields in the columns.
Table 4-8 shows the default table for each view.
Table 4-8. Default Table Views
View | Default table |
|---|---|
Bar Rollup | Rollup Table |
Detail Gantt | Delay |
Gantt Chart | Entry |
Leveling Gantt | Delay |
Milestone Date Rollup | Entry |
Milestone Rollup | Rollup Table |
Multiple Baselines Gantt | Entry |
PA_Expected Gantt | PA_Expected Case |
PA_Optimistic Gantt | PA_Optimistic Case |
PA_PERT Entry Sheet | PA_PERT Entry |
PA_Pessimistic Gantt | PA_Pessimistic Case |
Resource Allocation | Usage (Resource Usage view) Delay (Leveling Gantt view) |
Resource Sheet | Entry |
Resource Usage | Usage |
Task Entry | Entry |
Task Sheet | Entry |
Task Usage | Usage |
Tracking Gantt | Entry |
Table 4-9 lists a description of the task tables and their default fields.
Table 4-9. Task Tables and Their Default Fields
Default fields included | For more information | |
|---|---|---|
Baseline | ||
Specific baseline values reflecting the schedule as originally planned | ID, Task Name, Baseline Duration, Baseline Start, Baseline Finish, Baseline Work, and Baseline Cost | Saving Original Plan Information Using a Baseline in Chapter 10 |
Constraint Dates | ||
The specific constraint types for each task, along with associated dates where applicable; you can use these fields to review or change the constraint type and date | ID, Task Name, Duration, Constraint Type, and Constraint Date | |
Cost | ||
Cost information for each task, helping you analyze various types of cost calculations | ID, Task Name, Fixed Cost, Fixed Cost Accrual, Total Cost, Baseline, Variance, Actual, and Remaining | |
Delay | ||
Information to help you determine how long it will take to complete your tasks, given the resources you have and the amount of time they have for a given task | ID, Indicators, Task Name, Leveling Delay, Duration, Start, Finish, Successors, and Resources | |
Earned Value | ||
Earned value information that compares the relationship between work and costs based on a status date | ID, Task Name, BCWS, BCWP, ACWP, SV, CV, EAC, BAC, and VAC | |
Earned Value Cost Indicators | ||
Earned-value cost information, including the ratio of budgeted to actual costs of work performed. | ID, Task Name, BCWS, BCWP, CV, CV%, CPI, BAC, EAC, VAC, and TCPI | |
Earned Value Schedule Indicators | ||
Earned-value schedule information, including the ratio of work performed to work scheduled | ID, Task Name, BCWS, BCWP, SV, SV%, and SPI | |
Entry | ||
Fundamental information regarding tasks; this table is most useful for entering and viewing the most essential task information | ID, Indicators, Task Name, Duration, Start, Finish, Predecessors, and Resource Names | |
Export | ||
A large set of fields from which to export task fields to other applications such as Microsoft Office Excel or Microsoft Access | ID, Unique ID, Task Name, Duration, Type, Outline Level, Baseline Duration, Predecessors, Start, Finish, Early Start, Early Finish, Late Start, Late Finish, Free Slack, Total Slack, Leveling Delay, % Complete, Actual Start, Actual Finish, Baseline Start, Baseline Finish, Constraint Type, Constraint Date, Stop, Resume, Created, Work, Baseline Work, Actual Work, Cost, Fixed Cost, Baseline Cost, Actual Cost, Remaining Cost, WBS, Priority, Milestone, Summary, Rollup, Text1–10, Cost1–3, Duration1–3, Flag1–10, Marked, Number1–5, Subproject File, Contact, Start1–5, and Finish1–5 | |
Hyperlink | ||
Hyperlink information to associate linked shortcuts with your tasks | ID, Indicators, Task Name, Hyperlink, Address, and SubAddress | Hyperlinking to Documents in Other Applications in Chapter 16 |
PA_Expected Case | ||
Expected scheduling information based on PERT analysis of task durations | ID, Indicators, Task Name, Expected Duration, Expected Start, and Expected Finish | |
PA_Optimistic Case | ||
The best-case scheduling information based on PERT analysis of task durations | ID, Indicators, Task Name, Optimistic Duration, Optimistic Start, and Optimistic Finish | |
PA_PERT Entry | ||
The most probable duration information for a project, based on PERT analysis of task durations | ID, Task Name, Duration, Optimistic Duration, Expected Duration, and Pessimistic Duration | |
PA_Pessimistic Case | ||
The worst-case scheduling information based on PERT analysis of task durations | ID, Indicators, Task Name, Pessimistic Duration, Pessimistic Start, and Pessimistic Finish | |
Rollup Table | ||
Summarized task information that appears after you run the Rollup_Formatting macro | ID, Indicators, Task Name, Duration, Text Above, Start, Finish, Predecessors, and Resource Names | |
Schedule | ||
Detailed scheduling information that can help you see when a task is scheduled to begin and how late it can actually begin without jeopardizing the project’s finish date | ID, Task Name, Start, Finish, Late Start, Late Finish, Free Slack, and Total Slack | |
Summary | ||
Overview of project information to analyze durations, dates, progress, and costs | ID, Task Name, Duration, Start, Finish, % Complete, Cost, and Work | |
Tracking | ||
Actual progress and cost information, as contrasted with scheduled or baseline information | ID, Task Name, Actual Start, Actual Finish, % Complete, Physical % Complete, Actual Duration, Remaining Duration, Actual Cost, and Actual Work | |
Usage | ||
The most fundamental task schedule information | ID, Indicators, Task Name, Work, Duration, Start, and Finish | |
Variance | ||
Gaps between baseline start and finish dates and the actual start and finish dates, enabling a comparison between your original planned schedule and actual performance | ID, Task Name, Start, Finish, Baseline Start, Baseline Finish, Start Variance, and Finish Variance | |
Work | ||
A variety of measurements for analyzing the level of effort for each task | ID, Task Name, Work, Baseline, Variance, Actual, Remaining, and % Work Complete |
Table 4-10 lists a description of all resource tables and their default fields.
Table 4-10. Resource Tables and Their Default Fields
Information displayed | Default fields included | For more Information |
|---|---|---|
Cost | ||
Cost information about resources in a project | ID, Resource Name, Cost, Baseline Cost, Cost Variance, Actual Cost, and Remaining Cost | |
Earned Value | ||
Earned value information that compares the relationship between work and costs for resources based on a status date | ID, Resource Name, BCWS, BCWP, ACWP, SV, CV, EAC, BAC, and VAC | |
Entry | ||
Essential information regarding resources; this table is most useful for entering and viewing fundamental resource information | ID, Indicators, Resource Name, Type, Material Label, Initials, Group, Maximum Units, Standard Rate, Overtime Rate, Cost/Use, Accrue At, Base Calendar, and Code | |
Entry – Material Resources | ||
Essential information about consumable material resources | ID, Resource Name, Type, Material Label, Initials, Group, Standard Rate, Cost/Use, Accrue At, and Code | |
Entry – Work Resources | ||
Essential information about work (people and equipment) resources | ID, Resource Name, Type, Initials, Group, Maximum Units, Standard Rate, Overtime Rate, Cost/Use, Accrue At, Base Calendar, and Code | |
Export | ||
A large set of fields from which to export resource fields to other applications, such as Microsoft Excel or Access | ID, Unique ID, Resource Name, Initials, Maximum Units, Standard Rate, Overtime Rate, Cost Per Use, Accrue At, Cost, Baseline Cost, Actual Cost, Work, Baseline Work, Actual Work, Overtime Work, Group, Code, Text1–5, and Email Address | |
Hyperlink | ||
Hyperlink information to associate linked shortcuts with your resources | ID, Indicators, Resource Name, Hyperlink, Address, and SubAddress | Hyperlinking to Documents in Other Applications in Chapter 16 |
Summary | ||
Overview of resource information | ID, Resource Name, Group, Maximum Units, Peak, Standard Rate, Overtime Rate, Cost, and Work | |
Usage | ||
The most essential resource scheduling information | ID, Indicators, Resource Name, and Work | |
Work | ||
A variety of measurements for analyzing work, or the level of effort, for resources and their assigned tasks | ID, Resource Name, % Complete, Work, Overtime, Baseline, Variance, Actual, and Remaining | "Updating Progress Using Resource Work" in Chapter 10 |
To switch to a different table, follow these steps:
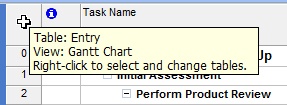
Display the view containing the table you want to change. This view could be theTask Sheet, Resource Sheet, Gantt Chart, Task Usageview, and so on.
Click View, Table.
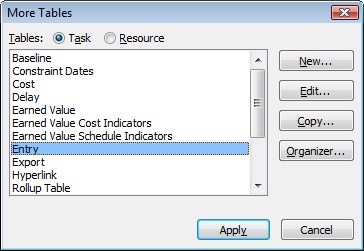
If the table is listed on the submenu, click it. If the table is not listed on the submenu, click More Tables (see Figure 4-16) and then double-click the table you want.
The table is replaced by the table you clicked.
Suppose that the Entry task table provides all the information you need except baseline values. You can easily add another column to any table, and you can just as easily remove superfluous columns. You can also make certain changes to the columns themselves.
Note
When working with columns in a table, you’re working with fields in your project database. Fields are discussed in more detail in the section titled Using Fields later in this chapter.
To add a column to a table, follow these steps:
Display the view and table to which you want to add a new column.
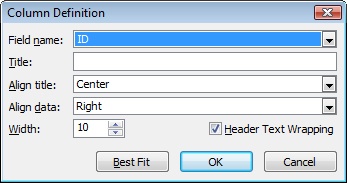
Right-click the column heading that will be to the right of the new column and then click Insert Column. The Column Definition dialog box appears.
Note
You can also open the Column Definition dialog box (see Figure 4-17) by clicking in a column and then clicking Insert, Column.
In the Field Name box, click the field representing the information you want in the new column.
To remove a column from a table, follow these steps:
Display the view and table from which you want to remove a column.
Right-click the heading of the column you want to remove and then click Hide Column.
The column is removed. The field and its contents still exist in the database, however, and can be displayed again in this or other tables.
Note
You can also remove a column by selecting the column heading and then clicking Edit, Hide Column. Or simply select the column heading and press the Delete key.
You can change the title of the column to something other than the actual field name. You can also modify the column text alignment and the column width. To modify a column, follow these steps:
Display the view and table containing the column you want to modify.
Double-click the heading of the column you want to change. The Column Definition dialog box appears.
To change the field information appearing in the column, in the Field Name list, click the field you want.
To change the title of the column heading, type a new title in the Title box.
Use the Align Title list to change the alignment of the column title.
Use the Align Data list to change the alignment of the field information itself.
Enter a number in the Width box to change the column width.
Note
You can also change the column width directly on the table, exactly as you do in Excel. Click the column’s heading to select the column. Then move the mouse pointer to the right edge of the column until the pointer changes to a black crosshair. Drag to the right to widen the column. Drag to the left to make the column narrower. Double-click the edge to widen the column to the same size as the longest entry in the column.
You can move a column to another location in the table simply by dragging. To move a column, follow these steps:
Display the view and table containing the column you want to move.
Click the heading of the column you want to move.
With the black crosshair mouse pointer over the column heading, drag to the new location for the column. As you drag, a gray line moves with the mouse pointer to indicate where the column will be inserted when you release the mouse button.
Note
In addition to adding and removing columns in existing tables, you can also create entirely new tables. For more information about tables, see the section titled Customizing Tables in Chapter 25.
Fields are the smallest piece of data in the vast collection of information that makes up your project database. For example, one task comprises a single record in this database.
This record consists of a number of task fields, such as the task name, duration, start date, finish date, assigned resource, deadline, and more.
Whether you see them in a view or not, there are numerous fields for your tasks, resources, and assignments, as well as for the project as a whole.
Some fields are entered by you, such as task name and duration. Other fields are calculated for you by Microsoft Project, such as start date, finish date, and total cost. Still other fields can either be entered by you or calculated by Microsoft Project.
From the discussion of views, tables, and the fields in those tables earlier in this chapter, you should already be familiar with the different field categories:
Task fields
Task-timephased fields
Resource fields
Resource-timephased fields
Assignment fields
Assignment-timephased fields
The timephased fields break down field information—such as work, costs, and availability—by time periods. This breakdown gives you more information to work with in your project. In the Task Usage and Resource Usage views, for example, you can see task cost by day or resource work by week. You can break either of those down further into the component assignments. The timephased fields also give you more tools for analysis through earned-value calculations.
Note
For more information about earned value analysis, see Chapter 13 titled Chapter 13.
Another way that fields are categorized is by data type. The data type indicates how a field can be used, for example, as a currency-type field, or a text-type field. The following are the field data types:
Currency. Information is expressed as a cost.
Date. Information is expressed as a date.
Duration. Information is expressed as a span of time.
Enumerated. Information is selected from a list of predefined choices.
Indicator. Information is shown as graphical indicators, or icons, about a task, resource, or assignment.
Integer. Information is expressed as a whole number.
Outline code. Information is defined with a custom tag for tasks or resources that enables you to show a hierarchy of tasks in your project.
Percentage/Number. Information is displayed as a value that can be expressed as either a percentage or decimal number, such as 100 percent or 1.00.
Text. Information is expressed as unrestricted characters of text.
Yes/No. Information is set to either Yes or No, that is, a True/False or Boolean value.
Fields make up your project database, the whole of which you might never see, or even have a need to see. You do see various fields throughout your project plan, in the following locations:
Columns in a table
Rows in a timesheet
Information in a network diagram node
Gantt bars and associated text in a Gantt chart
Fields in a form view
Fields in a dialog box
Some of these locations, such as columns in a table and rows in a timesheet, can be changed to suit your needs. Others, such as the fields in a dialog box, are fixed.
You can create your own custom fields and add them to tables in your views. There are custom fields you can define for currency, dates, durations, finish dates, start dates, text, numbers, outline codes, and more. Microsoft Office Project Professional 2007 includes an additional set of enterprise custom fields as well, so an enterprise can design a robust set of fields that standardizes how the enterprise manages projects.
Note
For more information about defining custom fields, see the section titled Customizing Fields in Chapter 25. For information about working with enterprise custom fields, see the section titled Working with Custom Enterprise Fields in Chapter 22.
Learn More About Microsoft Project Fields
You can immediately get comprehensive information about any field in a table. Position your mouse pointer over the column heading, and a ToolTip pops up that contains a link to online Help for this field. Click the link, and the Help topic appears.

You can also get lists of field categories and find information about fields by following these steps:
Click Help, Microsoft Office Project Help.
Under Browse Project Help, click Reference.
Click Fields Reference.
Click one of the field types, for example, Duration Fields. A complete list of fields of that type appears.
Click a field name, and its Help topic appears (see Figure 4-18).

These online Help topics about the fields contain the following information:
Data type (duration, cost, text, and so on)
Entry type (entered, calculated, or both)
Description (a general overview of the field’s function)
How Calculated (for calculated fields)
Best Uses (the purpose of the field)
Example (how this field might be used to facilitate a project plan)
Remarks (any additional information)