
Note 7. Instantaneous Sampling
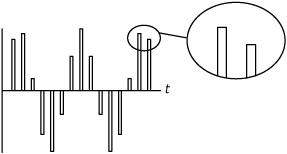
In instantaneous sampling, the value of the analog signal is captured at the sampling instant and held constant for the duration of the sample pulse, as shown in Figure 7.1. Instantaneous sampling is sometimes called “flat-topped” sampling or zero-order-data-hold sampling.
Figure 7.1. In instantaneous sampling, the amplitude of each sample remains constant over its width.

Instantaneous sampling is mathematically equivalent to convolving a single rectangular sampling pulse with an ideally sampled version of the original signal. Therefore, the spectrum of an instantaneously sampled signal can be determined by multiplying the ideally sampled signal’s spectrum with the spectrum of a single sample pulse.
Figure 7.2 summarizes the relationships between the original signal (labeled T2), the instantaneously sampled signal (labeled T5) and the corresponding spectra (labeled F2 and F5 respectively). A single pulse, p(t), (labeled T4 in the figure) defined by
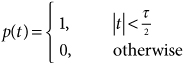
has the Fourier transform, P(f), (labled F4) given by
P(f) = τ sineH(fτ)
Figure 7.2. Instantaneous sampling is mathematically equivalent to convolving a single rectangular sampling pulse with an ideally sampled version of the original signal. Therefore, the spectrum of an instantaneously sampled signal can be determined by multiplying the ideally sampled signal’s spectrum with the spectrum of a single sample pulse. (“CTFT” indicates the continuous-time Fourier transform.)

At a Glance
• Instantaneous sampling (also known as zero-order-data-hold (ZODH) sampling) is a mathematical model that can be used to analyze the impact on signal quality of digital-to-analog conversion, as shown in Note 8.
• In instantaneous sampling, the samples have nonzero width and the amplitude of the sample remains constant across the width but varies from sample to sample to match the amplitude of the analog signal at each sample’s starting instant.
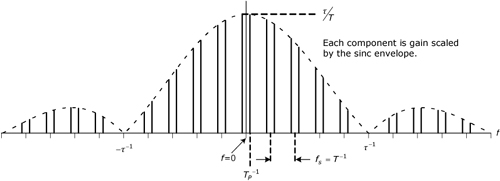
• In the magnitude spectrum of an instantaneously sampled signal, all spectral components are scaled by the magnitude of a sinc envelope. Because the scaling varies across the width of each spectral image, the signal is distorted.
The magnitude spectrum of an ideally sampled sinusoid is shown in Figure 7.3. Multiplying this spectrum (F3 in Figure 7.2) by P(f) yields the result shown in Figure 7.4. The scaling factor does not remain constant across each image, as it does in the spectrum for natural sampling. If the spectrum of the original spectrum is represented as X(f), then the spectrum of the corresponding instantaneously sampled signal is given by

Figure 7.3. Magnitude spectrum of ideally sampled sinusoid (corresponds to block F3 in Figure 7.2).
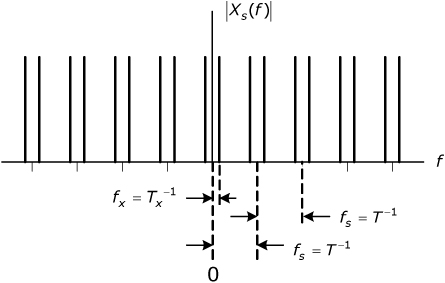
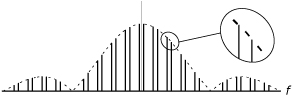
Figure 7.4. Magnitude spectrum of instantaneously sampled sinusoid (corresponds to block F5 in Figure 7.2)
Reference
1. W. R. Bennett, “Time division multiplex systems,” Bell Syst. Tech. J., vol. 20, 1941, pp. 199–221.