
Note 66. Generating I and Q Channels Digitally: Generalization of Rader’s Approach
Rader’s digital I and Q approach presented in Note 65 requires that the real bandpass IF signal be sampled at a rate equal to four times the signal’s bandwidth. This note shows how Rader’s scheme can be generalized to support sampling rates that are not four times the signal bandwidth.
Rader’s efficient IIR design for the complex filter depends upon downsampling by a factor of four, which in turn drives the requirement that the sampled I/F bandpass signal be centered at a frequency equal to one-fourth the sampling rate. This constraint is required so that downsampling by a factor of four shifts the surviving sideband to a center frequency of zero. If an FIR filter, or even a “standard” IIR filter, is used in place of Rader’s IIR phase-splitting design, this constraint on the I/F can be relaxed.
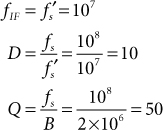
If Rader’s efficient IIR structure is not used, the important constraint is that the sample rate, fs, be an integer multiple of the intermediate frequency, and that after filtering, the signal is downsampled by the same integer factor so that the new sample rate, ![]() , equals the intermediate frequency:
, equals the intermediate frequency:
66.1

The relationship between fs, fIF, and M is constrained this way to ensure that the downsampling operation always creates a spectral image at zero frequency. However, Eq. (66.1) says nothing about the relationship between fIF and the bandwidth B. To avoid aliasing, the final sample rate, ![]() , must exceed the bandwidth:
, must exceed the bandwidth:

For convenience, let’s say that fs = QB, where Q ≥ D. For Rader’s original frequency plan, Q = D = 4, but there are many other possible combinations if downsampling by four is not needed to support the special IIR filter structure. The design case presented in the next section considers one of these alternatives.
66.1. Design Case
Figure 66.1 shows a sequence of models extracted from a simulation of pulse Doppler processing for a radar receiver. This simulation was constructed using some of the PracSim models discussed in [1]. Assume a transmit frequency of 5250.0 MHz. One of the inputs to the mixer is a received signal consisting of a tone at 5250.0 MHz, representing a return from stationary clutter, plus a tone at 5250.0128 MHz, representing a moving-target return that exhibits an inbound Doppler shift of 12.8 kHz. The reference tone is assumed to come from a frequency and timing source that is common to both the transmitter and receiver portions of the actual radar.
Figure 66.1. Block diagram for simulation of digital I/Q generation
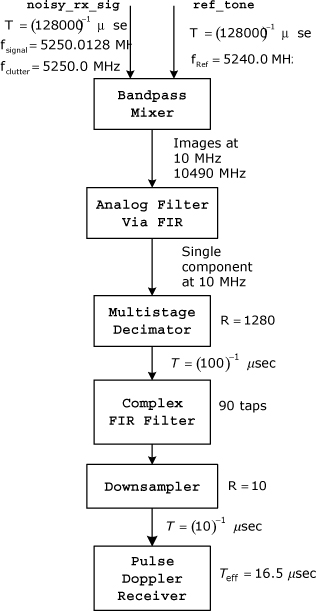
The bandwidth of the analog received signal varies depending upon the amount of Doppler shift created by moving targets in the radar’s field of view. Let’s assume that the bandwidth of the signal is guaranteed to be less than 2 MHz. Following Rader’s original frequency plan, we would specify a sampling rate of 8 MHz. However, let’s assume that this particular radar has several different operating modes, and one of these modes needs a sampling rate higher than 91 MHz. To avoid changing the ADC rate for different operating modes, we can design the pulse Doppler operation using an ADC rate of fs = 100 MHz and a final sample rate of ![]() MHz:
MHz:
For a received center frequency of 5250 MHz and a reference tone at 5240 MHz, the bandpass mixer produces signals centered at 10 MHz and at 10,490 MHz. The bandpass filter removes the high-frequency signal, leaving only the signal at 10 MHz. The mixer inputs, mixer output, and bandpass filter output are all analog signals that are simulated in this reference design using a sampling rate that corresponds to 1.28 ×10¹¹ samples per second.
The multistage decimator performs filtering and downsampling to reduce the sample rate to 108 samples per second. The decimator output in the simulation corresponds to the ADC output in Figure 65.1 in Note 65. (Quantization performed by the ADC is not included in this simulation.)
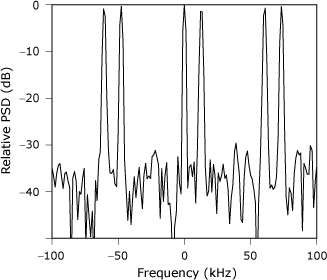
The power spectral densities of the mixer output and decimator output are shown in Figures 66.2 and 66.3, respectively. The complex FIR filter model implements the 90-tap design having the response shown in Figures 66.4 and 66.5 that was developed in Example 63.1 of Note 63. The PSD for the complex filter’s output is shown in Figure 66.6. The attenuated negative-frequency sideband is clearly visible. A zoomed view of the PSD in the vicinity of 10 MHz is shown in Figure 66.7. All of the fine structure shown in this view is due to the pulse gating of the radar signal. Figure 66.8 shows the corresponding view of the PSD when the gating is disabled and a continuous tone is transmitted. The center-to-center spacing of the fingers in Figure 66.7 is 60.6 kHz, which corresponds to the pulse repetition frequency (PRF) of the gating pulses. The amplitudes of these fingers follow an envelope that corresponds to the spectrum of a single rectangular gating pulse.
Figure 66.2. Power spectral density for output of mixer model
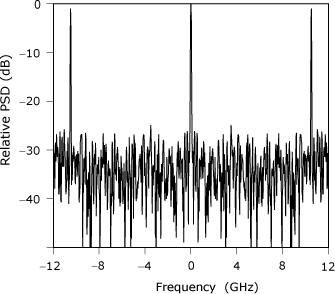
Figure 66.3. Power spectral density at decimator output
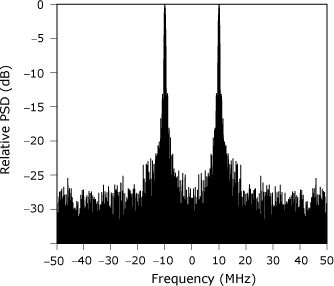
Figure 66.4. Magnitude response of 90-tap complex filter designed in Example 63.1 of Note 63
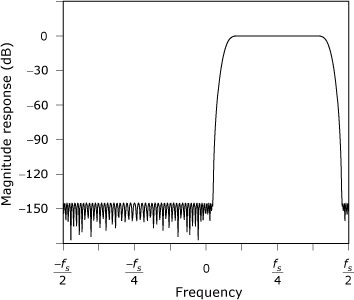
Figure 66.5. Phase response of 90-tap complex filter designed in Example 63.1 of Note 63
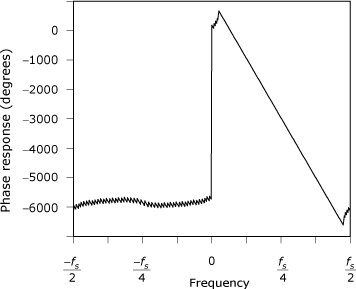
Figure 66.6. Power spectral density at output of the complex filter
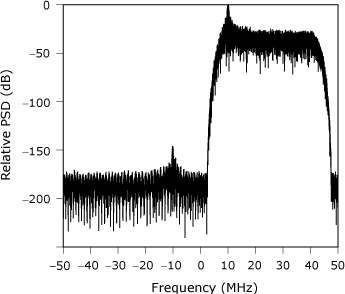
Figure 66.7. Enlarged view of the detail near 10 MHz for the PSD shown in Figure 66.6
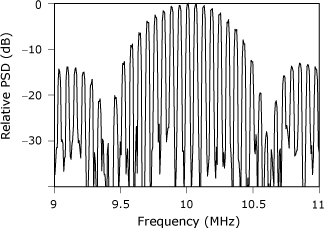
Figure 66.8. Enlarged view of the detail near 10 MHz for the PSD of the complex filter output when pulse gating of the transmitter signal is disabled

The downsampler implements our choice of D = 10 to yield a final sample rate of 107. Figure 66.9 shows the low-frequency details for the PSD of the downsampler output. The components at zero and 12.8 kHz are the ones we’re expecting to find based on the makeup of the original received signal. The other components are images due to the pulse gating.
Figure 66.9. Power spectral density at output of the final downsampler
Reference
1. C. B. Rorabaugh, Simulating Wireless Communication Systems, Prentice Hall, 2004.