Note 26. Unmodified Periodogram
This note presents the definition and basic properties of the unmodified periodogram. The unmodified periodogram is the simplest of the classical, nonparametric, DFT-based methods that are used to estimate the power spectrum of a discrete-time signal. Examples of its performance against various signal combinations and noise conditions are also presented.
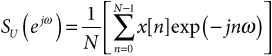
For a discrete-time signal, x[n], the unmodified periodogram, SU [m], is computed as the normalized, squared magnitude of the N-point DFT for an L-sample segment of the signal that has been padded with N – L zeros (see Note 16: Exploring DFT Resolution for a discussion of zero-padding in the DFT):
26.1
![]()
where X [m] is the slightly modified DFT given by
26.2
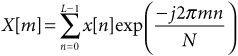
In order to generate a periodogram plot that appears to be a function of continuous frequency, it is a common practice to use a DFT length, N, that is many times larger than the number of signal samples, L. In fact, the periodogram is formally defined as a function of continuous frequency that involves the DTFT of x[n]. However, in practice, the periodogram is evaluated at a number of discrete frequencies using the DFT as in Eq. (26.2). It is not necessary to include the N–L zero-valued padding samples explicitly in Eq. (26.2). The denominator in the exponential factor is based on an N-point DFT, but the zero-valued samples are implicitly included by having the upper summation limit of L–1 rather than N–1.
The unmodified periodogram is also referred to as the sample spectrum or simply periodogram. The use of the descriptor “unmodified” is primarily to emphasize the distinction between Eq. (26.1) and the modified periodogram that is discussed in Note 29.
The unmodified periodogram’s advantage over other spectrum estimation techniques is its simplicity and relatively low computational burden (particularly if the periodogram is evaluated using a DFT that is sized to allow implementation via an efficient FFT algorithm). These advantages can be decisive in an application such as a front-panel spectrum display in a consumer audio device. In such an application, the performance requirements might be quite lax—the high and low frequency content of the displayed spectrum needs only to appear correlated to the audio that is playing. In addition, because the input signal is truncated with a simple rectangular window, the unmodified periodogram’s response to a distinct sinusoidal component has the narrowest main-lobe response available from any periodogram technique.
Math Box 26.1. Properties of the Unmodified Periodogram
Definition
MB 26.1
Bias
MB 26.2
![]()
where ε indicates expected value, Sx(ejω) is the true power spectrum of x, and WB(ejω) is the Fourier transform of the Bartlett window. The presence of WB(ejω) in Eq. (MB 26.2) indicates that the unmodified periodogram is a biased estimate of Sx(ejω). However, as N becomes very large, WB(ejω) approaches an impulse function, so
MB 26.3
![]()
Therefore, the unmodified periodogram is said to be an asymptotically unbiased estimate of Sx(ejω). The appearance of a Bartlett window in Eq. (MB 26.2) might seem odd given that the unmodified periodogram does not involve the explicit use of a window function. However, like all “unwindowed” DFTs, the periodogram does implicitly involve a rectangular window to accomplish the truncation of the input sequence to just N nonzero samples. By Parseval’s theorem, the power spectrum is the Fourier transform of the autocorrelation function, and the autocorrelation of two rectangular windows is a triangular window—hence the convolution by WB(ejω) in Eq. (MB 26.2).
6-dB Bandwidth of Bin Response
MB 26.4
![]()
Variance
MB 26.5
![]()
References
1. S. L. Marple, Digital Spectral Analysis with Applications, Prentice Hall, 1987.
2. M. H. Hayes, Statistical Digital Signal Processing and Modeling, Wiley, 1996.