
12.2 Spreadsheets
A variety of spreadsheet programs are available today. You may already have some experience with spreadsheets, though we don’t assume any background knowledge in this discussion. Each spreadsheet program has its own particular nuances regarding its abilities and syntax, but all spreadsheets embrace a common set of concepts. Our discussion in this chapter focuses on these common concepts. The specific examples that we explore are consistent with the syntax and functionality of the Microsoft Excel spreadsheet program.
A spreadsheet is a software application that allows the user to organize and analyze data using a grid of labeled cells. A cell can contain data or a formula that is used to calculate a value. Data stored in a cell can be text, numbers, or “special” data such as dates.
As shown in FIGURE 12.1, spreadsheet cells are referenced by their row and column designation, usually using letters to specify the column and numbers to specify the row. Thus we refer to cells as, for example, A1, C7, and G45. After the 26th column, spreadsheets begin to use two letters for the column designation, so some cells have designations such as AA19. There is usually some reasonably large maximum number of rows in a spreadsheet, such as 256. Furthermore, in most spreadsheet programs, multiple sheets can be combined into one large interacting system.
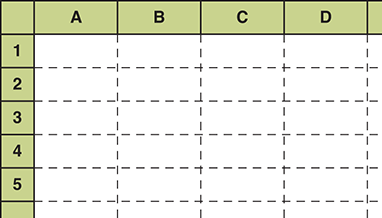
FIGURE 12.1 A spreadsheet, made up of a grid of labeled cells
Spreadsheets are useful in many situations, and they are often designed to manage thousands of data values and calculations. Let’s look at a small example that demonstrates fundamental spreadsheet principles. Suppose we have collected data on the number of students who came to get help from a set of tutors over a period of several weeks. We’ve kept track of how many students went to each of three tutors (Hal, Amy, and Frank) each week for a period of five weeks. Now we want to perform some basic analysis on that data. We might end up with the spreadsheet shown in FIGURE 12.2.

FIGURE 12.2 A spreadsheet containing data and computations
This spreadsheet contains, among other things, the raw data to be analyzed. Cell C4, for instance, contains the number of students whom Hal tutored in week 1. The column of data running from C4 to C8 contains the number of students tutored by Hal in each of the five weeks during which data was collected. Likewise, the data for Amy is stored in cells D4 through D8, and the data for Frank is stored in cells E4 through E8. This same data can be thought of in terms of the row it is in. Each row shows the number of students helped by each tutor in any given week.
In cells C9, D9, and E9, the spreadsheet computes and displays the total number of students helped by each tutor over all five weeks. In cells C10, D10, and E10, the spreadsheet also computes and displays the average number of students helped by each tutor each week. Likewise, the total number of students helped each week (by all tutors) is shown in the column of cells running from F4 to F8. The average number of students helped per week is shown in cells G4 to G8.
In addition to the totals and averages per tutor and per week, the spreadsheet calculates some other overall statistics. Cell F9 shows the total number of students helped by all tutors in all weeks. The average per week (for all tutors) is shown in cell F10, and the average per tutor (for all weeks) is shown in cell G9. Finally, the average number of students helped by any tutor in any week is shown in cell G10.
The data stored in columns A and B and in rows 2 and 3 are simply used as labels to indicate what the values in the rest of the spreadsheet represent. These labels are meant to enhance the spreadsheet’s human readability only and do not contribute to the calculations.
Note that the labels and some of the values in the spreadsheet in Figure 12.2 are shown in different colors. Most spreadsheet programs allow the user to control the look and format of the data in specific cells in various ways. The user can specify the font, style, and color of the data as well as the alignment of the data within the cell (such as centered or left justified). In the case of real numeric values, such as the averages computed in this example, the user can specify how many decimal places should be displayed. In most spreadsheet programs, the user can also dictate whether the grid lines for each cell are displayed or remain invisible (in this example they are all displayed) and what the background color or pattern of a cell should be. All of these user preferences are specified with menu options or buttons in the spreadsheet application software.
Spreadsheet Formulas
In our example spreadsheet, we performed several calculations that gave us insight into the overall situation regarding tutor support. It turns out that it is relatively easy to set up these calculations. You might say that it wouldn’t take long to sit down with these numbers and produce the same statistics with a calculator, and you would be right. However, the beauty of a spreadsheet is that it is both easily modified and easily expanded.
If we’ve set up the spreadsheet correctly, we could add or remove tutors, add additional weeks of data, or change any of the data we have already stored—and the corresponding calculations would automatically be updated. For example, although we set up the tutor spreadsheet to use the data of three tutors, the same spreadsheet could be expanded to handle hundreds of tutors. Instead of five weeks of data, we could just as easily process a year’s worth.
The power of spreadsheets comes from the formulas that we can create and store in cells. All of the totals and averages in the example in Figure 12.2 are computed using formulas. When a formula is stored in a cell, the result of the formula is displayed in the cell. Therefore, when we look at the values in a spreadsheet, it is sometimes challenging to tell whether the data shown in a particular cell was entered directly or computed by an underlying formula.
FIGURE 12.3 shows the same spreadsheet as Figure 12.2, indicating the formulas underlying some of the cells. Formulas in our examples (as in many spreadsheet programs) begin with an equal sign (=). That’s how the spreadsheet knows which cells contain formulas that must be evaluated.

FIGURE 12.3 The formulas behind some of the cells
The formulas in this example refer to particular cells (by their column and row designation). When a formula is evaluated, the values stored in the referenced cells are used to compute the result. Formulas in a spreadsheet are reevaluated whenever the spreadsheet changes; therefore, the results are always kept current. A spreadsheet is dynamic—it responds to changes immediately. If we changed the number of students whom Frank tutored in week 2, the totals and averages that use that value would be recalculated immediately to reflect the revised data.
Formulas can make use of basic arithmetic operations using the standard symbols (+, 2, *, and /). They can also take advantage of spreadsheet functions that are built into the software. In the tutor example, the formula in cell C9 uses the SUM function to compute the sum of the values in the cells C4, C5, C6, C7, and C8.
Because functions often operate on a set of contiguous cells, spreadsheets provide a convenient way to specify a range of cells. Syntactically, a range is specified with two dots (periods) between the two cell endpoints. A range can specify a set of cells along a row, such as C4..E4, or it can specify a set of cells down a column, such as C4..C8. A range can also specify a rectangular block of cells, ranging from the top left to the bottom right. For example, the range C4..E8 includes the cells C4 to C8, D4 to D8, and E4 to E8.
Several of the formulas shown in Figure 12.3 use the COUNT function, which computes the number of nonblank cells in the specified range. For example, the formula in cell G7 divides the value in cell F7 by the count of cells in the range C7..E7, which is 3.
The formula in cell G7 could have been written as follows:
=SUM(C7..E7)/3
Given the current status of the spreadsheet, this formula would compute the same result. However, this formula is not as good as the original, for two reasons. First, the sum of the values in C7 to E7 has already been computed (and stored in F7), so there is no need to recompute it. Any change to the data would affect the value of F7, and consequently change the value of G7 as well. Spreadsheets take all such relationships into account.
Second (and far more important), it is always a good idea to avoid using a constant in a formula unless it is specifically appropriate. In this case, using the value 3 as the predetermined number of tutors limits our ability to easily add or delete tutors from our analysis. Spreadsheet formulas respond to insertions and deletions just as they do to changes in raw data itself. If we insert a column for another tutor, the ranges in the original formulas in columns F and G (which would move to columns G and H due to the insertion) would automatically change to reflect the insertion. For example, if a new tutor column is inserted, the formula in cell F4 would be shifted to cell G4 and would now be
=SUM(C4..F4)
That is, the range of cells would increase to include the newly inserted data. Likewise, the ranges used by the COUNT function in other functions would change, resulting in a new—and correct—average. If we had used the constant 3 in the formula of cell G7, the calculation would be incorrect after the new column was inserted.
Usually a spreadsheet program provides a large number of functions that we can use in formulas. Some perform math or statistical calculations, common financial calculations, or special operations on text or dates. Others allow the user to set up logical relationships among cells. Examples of some common spreadsheet functions appear in FIGURE 12.4. A typical spreadsheet program provides dozens of functions that the user may incorporate into formulas.
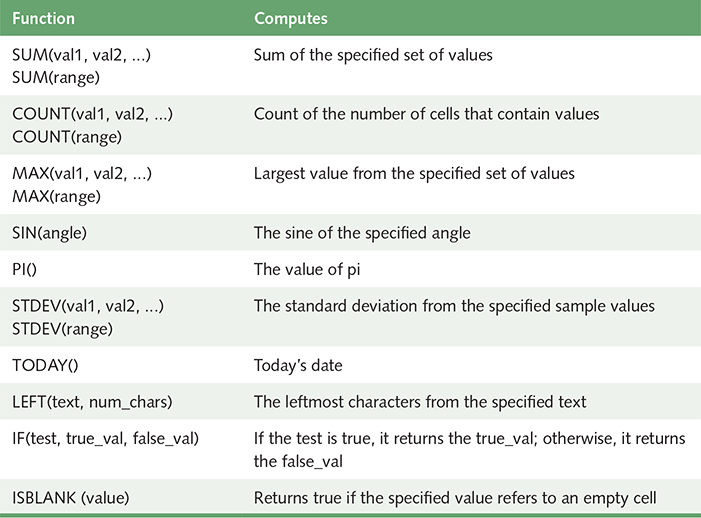
FIGURE 12.4 Some common spreadsheet functions
Another dynamic aspect of spreadsheets is the ability to copy values or formulas across a row or down a column. When formulas are copied, the relationships among cells are maintained. As a result, it becomes easy to set up a whole set of similar calculations. For instance, to enter the total calculations in our tutor example down the column from cell F4 to cell F8, we simply had to enter the formula in cell F4, and then copy that formula down the column. As the formula is copied, the references to the cells are automatically updated to reflect the row that the new formula is in. For our small example that tracks five weeks, the copy ability didn’t save that much effort. But imagine we were tracking this data for a whole year and had 52 summation formulas to create. The copy aspect of spreadsheets makes setting up that entire column a single operation.
Circular References
Spreadsheet formulas could be defined such that they create a circular reference—that is, a reference that can never be resolved because the result of one formula is ultimately based on another, and vice versa. For instance, if cell B15 contains the formula
=D22+D23
and cell D22 contains the formula
=B15+B16
there is a circular reference. Cell B15 uses the value in cell D22 for its result, but cell D22 relies on B15 for its result.
Circular references are not usually this blatant and may involve many cells. A more complicated situation is presented in FIGURE 12.5. Ultimately, cell A1 relies on cell D13 for its value, and vice versa. Spreadsheet software usually detects such a problem and indicates the error.

FIGURE 12.5 A circular reference situation that cannot be resolved
Spreadsheet Analysis
One reason why spreadsheets are so useful is their versatility. The user of a spreadsheet determines what the data represents and how it is related to other data. Therefore, spreadsheet analysis can be applied to just about any topic area. We might, for instance, use a spreadsheet to perform the following tasks:
Track sales
Analyze sport statistics
Maintain student grades
Keep a car maintenance log
Record and summarize travel expenses
Track project activities and schedules
Plan stock purchases
The list of potential applications is virtually endless. Business, in general, has a huge number of specific situations in which spreadsheet calculations are essential. It makes you wonder how we got along without them.
Their dynamic nature also makes spreadsheets highly useful. If we set up the spreadsheet formulas correctly, then our changes, additions, and deletions to the data are automatically taken into account by the appropriate calculations.
The dynamic nature of spreadsheets also provides the powerful ability to carry out what-if analysis. We can set up spreadsheets that take into account certain assumptions, and then challenge those assumptions by changing the appropriate values.
As an example, suppose we are setting up a spreadsheet to estimate the costs and potential profits for a seminar we are considering holding. We can enter values for the number of attendees, ticket prices, cost of materials, room rental, and other data that affects the final results. Then we can ask ourselves some what-if questions to see how our scenario changes as the situation changes:
What if the number of attendees decreased by 10%?
What if we increased the ticket price by $5?
What if we could reduce the cost of materials by half?
As we ask these questions, we change the data accordingly. If we’ve set up the relationships among all of the formulas correctly, then each change immediately shows us how it affects the other data.
Business analysts have formalized this process in various ways, and spreadsheets have become an essential tool in their daily work. Cost– benefit analysis, break-even calculations, and projected sales estimates all become a matter of organizing the spreadsheet data and formulas to take the appropriate relationships into account.
Spreadsheet Visualizations
They say a picture is worth a thousand words. Well, that’s true about numbers, too. Reading raw data is often hard, and rarely provides the insight that a good visual representation of the data can. The goal of data analysis is to provide insight into the data that can be communicated to others.
Modern spreadsheet applications usually provide a mechanism for displaying the data in the spreadsheet in various types of graphs, such as line charts or pie charts. In fact, the number of graph types is often quite extensive, and allows you to tailor exactly how best to convey the ideas you want to emphasize. An example of a graph generated by Microsoft Excel is shown in FIGURE 12.6.
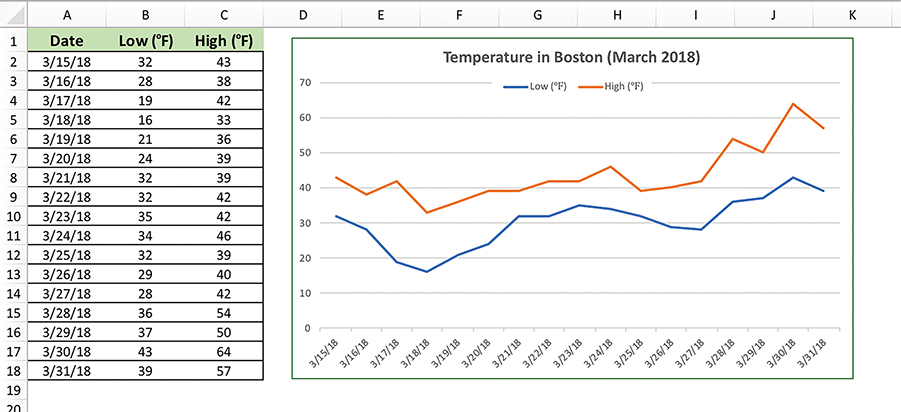
FIGURE 12.6 A graph generated using spreadsheet data
As with “what if” analysis, as the data changes, the generated graphs can change to reflect the modifications.