
14.3 Computer Graphics
Computer graphics can be very generally described as the setting of pixel values on the computer screen. Recall that we talked about computer images in Chapter 3. At that time, we said that an image is a collection of pixel values specified as the red, green, and blue values. Although that earlier discussion referred to pictures we could scan and display on a computer screen, it also applies to everything we display on a computer screen.
The field of computer graphics plays a role in many aspects of computer science. The most common application is in the graphical user interface (GUI) of modern operating systems. Files and folders are represented as icons on the screen, with the icon indicating the file type. Interacting with the computer involves pointing, clicking, and dragging, which change the appearance of the screen. Computer graphics determines how to set the pixel colors to display the icons and how to change the pixel values as an icon is dragged across the screen.
Word processors and desktop publishing software are other applications of computer graphics. Their ability to show how the document will appear when printed is made possible by the way pixels are set on the screen. Although you might not think about black-and-white text on the screen when you think of computer graphics, it is still involved in the display. Illustrations in user’s manuals are also generated with computer graphics. In this application, special techniques are used to produce images that highlight the feature or part being discussed instead of creating fully realistic images.
Companies also use computer graphics in the design and manufacturing of products. Computer-aided design (CAD) systems let engineers create the specification of new components using geometric modeling techniques (as in FIGURE 14.3). These parts can be displayed on the screen and can even be tested for stress points that could potentially break. These drawings can eventually be used to give instructions to assembly-line machines that create the parts.
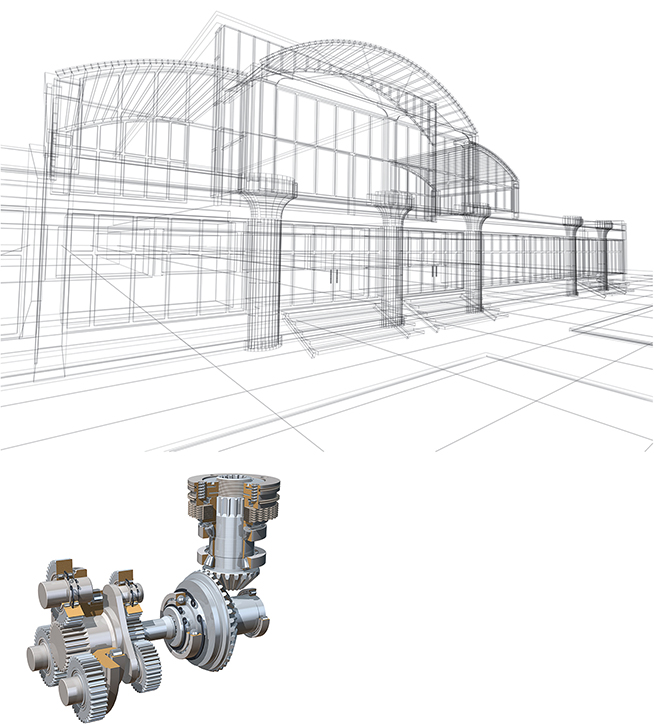
FIGURE 14.3 Geometric modeling techniques
© ArtyFree/Shutterstock; © Stephen Sweet/Shutterstock
Artists use computer graphics in many ways. Some artists use a computer as a high-tech canvas. Paint programs allow artists to create works using the computer instead of brushes and canvas. Image manipulation software allows photographers to touch up pictures or to combine multiple images to create unique effects. Artists also use the computer as an integral part of the artwork. For example, as far back as 1982, Jane Veeder created the WARPITOUT computer installation, which allowed users to take their pictures digitally and then manipulate them before they became part of a rotating gallery of recent images.
Scientific experimentation and simulations inevitably produce large amounts of data. A scientist who examines data as numbers on a page might miss a trend or pattern in those data. An alternative means of analysis is scientific visualization with data presented in a graphical format. Scientific visualization systems allow the user to change the colors associated with different values and create cross-sections through the data to help discover patterns or trends. A related application is in medical imaging. Results of tests using technologies such as computerized tomography (CT), ultrasound, and magnetic resonance imaging (MRI) are presented in a graphical form, which a doctor or technician can then use to make a diagnosis.
Even though numerous applications of computer graphics exist, it is likely that when you think about computer graphics, you imagine computer games, animated films, or special effects on television and movies. These are the most “fun” of the applications—but also the most complex. The complexity comes from the need to simulate very complex processes—the interaction of light and objects, modeling of the shapes of simple and complex objects, the natural movement of characters and objects. The rest of this section will look at some of these issues in more detail. As you will see, there are a lot of details in computer graphics, which makes it a complex as well as a fun area of study. Because computer graphics is broad enough to be the subject of entire textbooks, this section can merely give you a hint of what’s involved.
How Light Works
The human visual system works because light reflects off objects and enters our eyes. The lens of the eye focuses the light as it strikes the back of the eye. The back of the eye is composed of cone and rod cells that react to the light that strikes them. The cone cells come in three varieties—long, middle, and short—based on the wavelength of light they react to. The long cones react to red shades; the middle cones react to green shades; and the short cones react to blue shades. The rod cells react only to the intensity of the light, so they lack color sensitivity. The reactions in the cone and rod cells are interpreted by our visual system and brain, which ensure that we see objects in front of us.
Light in our world strikes objects, reflecting off of them. Although we might think of mirrors and polished objects as being the only reflective ones, in reality all objects reflect light. The amount of light that is reflected depends on the amount of light available. On a sunny day, many more objects are visible than on a cloudy day or at a time late in the evening.
In addition to the amount of light, the appearance of an object is influenced by what the object is made of. For example, plastic, wood, and metal all look different because of their properties. Plastic objects have color particles embedded in them but they have very shiny surfaces. Highlights on plastic objects are the same color as the light, no matter what color the object is. Wood objects are influenced by the grains in the wood, which reflect light unevenly. Metal objects have microscopically rough surfaces, so they have highlights, albeit not as sharp as those on plastic.
Consider a flat mirror. The direction in which the mirror points can be specified by its normal vector (N), which is perpendicular to the mirror surface (FIGURE 14.4). The angle that light reflects off the mirror (u) will be the same relative to the normal vector as the angle from which the light arrives. If you are in the direction of a view vector (V), what you see will be influenced by the directions of all of these vectors. The entire process is complex because light can strike the mirror from many different directions. When you look at yourself in a mirror, light reflects off your face and clothes from different directions before entering your eye.

FIGURE 14.4 The normal (N), light (L), view (V), and reflection (R) vectors
Shadows are an important component of our world. They give us visual cues about the locations of objects and light sources. They also give us cues about the relative locations of two objects. If two objects are touching, for example, the shadow cast by one of the objects will be very close to that object. As the objects move apart, the shadow will change and, depending on the lighting conditions, could even disappear. This explains why some early hand-drawn cartoons seem odd: Some include shadows for the characters and some don’t. Mickey Mouse casts a shadow but Fred Flintstone doesn’t. The result is that Mickey seems to be walking on the ground, whereas Fred seems to be floating in air.
To produce realistic images, computer programs must do calculations that simulate the interaction between light and an object, the irregular surface of a textured object, and the change in light intensity in locations in shadows. These calculations can take a lot of time. Animated films and movie special effects look better than computer games because simplifications and shortcuts are needed so that a game can generate images in real time. Another important component of this process is the representation of the shape of objects in the image, which is discussed next.
Object Shape Matters
The shape of an object also influences the appearance of the object. When an object is flat, like a mirror, there is one normal vector direction for every location on the object. If an object is not flat, the normal vector direction can be different at various locations. This change in normal vector direction alters the highlight shape, which gives us visual cues as to the shape of the object.
Recall from your math classes that we use equations to describe lines, planes, spheres, cylinders, and other objects. These equations are used in computer graphics to specify the shapes of objects. If you look around, you will see that objects have a wide variety of shapes. Many are much more complex than these simple mathematical objects. Computer graphics also offers ways to mathematically describe the shapes of curved surfaces. Complex objects are then defined by a collection of individual curves.
Even though objects in our world are solid, computer graphics deals only with the surface of objects, because that is all we see. Additionally, these mathematical equations define smooth surfaces, even though real objects may have irregular surfaces. For example, bricks and concrete have a rough surface that will scatter light differently than a smooth surface does. Graphics software uses texture mapping techniques to simulate these rough surfaces.
Simulating Light
A number of techniques are used to simulate the interaction of light and objects in graphics. Some techniques are simple; others are very computationally complex. In general, the simulation of light interacting at one point on an object is called an illumination model, while the process of using an illumination model to determine the appearance of an entire object is called a shading model or just shading. The process of creating an entire image is called rendering.
One of the earliest illumination models from 1971 uses three different components: ambient light, diffuse reflections, and specular reflections. Ambient light is a general light that doesn’t have a direction. This sort of light makes it possible for us to see objects that don’t have light directed at them. Diffuse reflections occur because light strikes an object directly. These reflections occur in every direction and are based on the angle between the light direction and the surface normal (u in Figure 14.4). The closer the light direction and the surface normal, the larger the diffuse reflection contribution will be. Specular highlights are the bright spots that appear on objects because of the mirror reflection direction. The specular reflection is based on the angle between the reflection direction and the viewer direction (a in Figure 14.4). The closer they are, the larger the specular reflection contribution will be. An object’s appearance is determined by adding the ambient light, diffuse reflection, and spec-ular reflection together. Although it was developed a long time ago, this illumination model is still commonly used in today’s graphics software.
This illumination model does have a notable problem: It makes everything look like it is made of plastic. For this reason, adjustments have to be made to the results it produces to handle metal objects and objects with textures. The illumination model also cannot handle transparent objects or objects with mirror-like surfaces.
A second shading method is called ray tracing. In this method, a point in space is identified where the viewer is located. Then the location of the screen (where the image is to be drawn) is determined. Now a line can be drawn from the viewer location through each pixel location of the image. That line or ray is followed into the scene. If it doesn’t hit any of the objects, that pixel is colored to match the background color. If it does hit an object, the illumination calculation is performed for that point and the result becomes the pixel color. If the object that is hit is reflective, like a mirror, the direction the ray reflects off the object is calculated and this new direction is followed to determine the pixel color. If the object that is hit is transparent, the direction the ray refracts into the object is calculated and this new direction is followed. Highly complex objects could be both reflective and transparent, so both of these calculations might be done and their results combined. Because the rays are followed as they bounce around a scene, ray tracing can handle both transparent and reflective objects.
You may have noticed that sometimes the color of your shirt reflects onto your face or arms. This phenomenon is called color bleeding. Another example occurs when someone wearing a bright red shirt stands near a white wall. The wall near the person can look pink because light reflects off the red shirt before striking the wall. None of the shading methods discussed so far can simulate this type of light interaction, but a technique called radiosity can handle color bleeding. In radiosity, light is treated as energy. Complex calculations look at how much energy is transferred from every object to every other object in a scene. Because the amount of energy received by a large object such as a wall will be different for different parts of the wall, large objects are subdivided into much smaller pieces before the energy interaction is calculated.
The amount of energy transferred between two patches in the scene depends on how far apart the two patches are and in which direction the patches are pointing. The farther apart two patches are, the less energy they will transfer. The closer the patches are to facing each other, the more energy they will transfer. This process is further complicated by the fact that Patch A can transfer energy to Patch B and, conversely, Patch B can transfer energy to Patch A. Additionally, the amount of energy Patch A has available to transfer to Patch B depends in part on how much energy Patch A gets from Patch B. Likewise, the amount of energy Patch B transfers to Patch A depends on the amount of energy Patch A transfers to it.
Radiosity is highly complex not only because of all of the potential combinations of energy transfer, but also because a scene can have more than 100,000 patches for which this energy transfer must be determined.
Modeling Complex Objects
Earlier we said that the shapes of simple objects could be modeled with simple mathematical objects and curved surfaces. Many objects in our world are much more complex in terms of their shapes and the ways that they interact with light. This is one area where graphics researchers are working to produce realistic simulations of natural phenomena that can be rendered in a reasonable amount of time. This section looks at some of these issues in a general way.
Natural landscapes provide a mixture of graphics challenges: realistic-looking terrain, reasonable-looking streams, and natural-looking plants. FIGURE 14.5 shows a natural-looking computer-generated landscape. Terrain can be modeled with fractal or erosion models. One fractal model uses a technique called midpoint subdivision. With this technique, you begin with a triangular patch. Each side of the triangle is subdivided at the midpoint, and extra edges are added between these points to give 4 triangular patches. The process is repeated again for each of the 4 patches, which produces 16 triangular patches. This result isn’t all that interesting by itself. However, if each of the midpoints is randomly moved up or down when subdivided, it generates an irregular terrain shape (FIGURE 14.6). Erosion models can be used to place streams and form the terrain around them. In an erosion model, the starting or ending point of the stream is chosen and then the stream is randomly moved through the terrain. The stream location sets the terrain height at those locations, and the areas around the stream can then be raised to irregular levels.

FIGURE 14.5 A natural computer-generated landscape
Reproduced from Oliver Deussen, et. al., “Realistic Modeling and Rendering of Plant Ecosystems.” SIGGRAPH (1998): 275-286. © 1998 AMC, Inc. Reprinted by permission. [http://doi.acm.org/10.1145/280814.280898]

FIGURE 14.6 Midpoint sub division for creating fractal terrains
Plant growth has been modeled through both grammar and probabilistic methods. In grammar-based tree models, rules much like those in English grammar specify how components of a plant change. For example, one rule might specify that a bud becomes a flower, while another rule specifies that a bud becomes a branch section with a new bud at its end. Different sets of rules will create different types of plants. Making choices among one set of rules will produce different examples of one plant type. Plant growth can be specified with as few as five to ten rules, depending on the complexity of the plant. In probabilistic models, actual plants are studied to see how they grow. The probabilities of events—for example, that a bud on a plant will stay dormant, become a flower and die, become a new branch or set of branches, or just die—are measured. The lengths of branches and their relative positioning are also measured. The computer then uses all of these probabilities to generate plant shapes for rendering.
Liquids, clouds, smoke, and fire pose special challenges for graphics applications. Scientific researchers have developed equations that approximate the behavior of liquids, gases, and fire. Graphics researchers have, in turn, used these equations to create images of those phenomena. When modeling liquids and gases for computer graphics, the space the liquid or gas will occupy is subdivided into cubic cells. Data on atmospheric pressure, density, gravity, and external forces are used with these equations to determine how the material moves between cells. FIGURE 14.7 shows an example of water produced by this method. A cell-based model of clouds looks at the humidity and the presence of clouds in the current and adjacent cells to determine whether a cloud should appear in the current cell. Random numbers are also used to influence cloud formation and movement. These techniques can produce realistic clouds, as seen in FIGURE 14.8. Because smoke and fire are the results of the combustion of a material, heat contributes to the turbulence of the flame and smoke. Equations are also used to model the velocity of fire and smoke particles for the production of images such as those shown in FIGURES 14.9 and 14.10.

FIGURE 14.7 Water pouring into a glass
Reproduced from Douglas Enright, et. al., “Animation and Rendering of complex Water Surfaces.” SIGGRAPH 21 (2002): 275-286. © 2002 AMC, Inc. Reprinted by permission. [http://doi.acm.org/10.1145/566654.566645]

FIGURE 14.8 Cellular automata-based clouds
Reproduced from Yoshinori Dobashi, et. al., “A Simple, Efficient Method for Realistic Animation of Clouds.” SIGGRAPH (2000): 19-28. © 2000 AMC, Inc. Reprinted by permission. [http://doi.acm.org/10.1145/344779.344795]
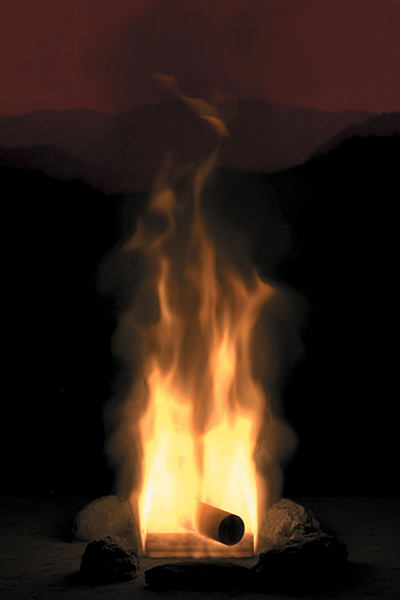
FIGURE 14.9 A campfire
Reproduced Duc Quang Nguye, et. al., "Physically Based Modeling and Animation of Fire." SIGGRAPH (2002): 721-728. © 2002 AMC, Inc. Reprinted by permission. [http://doi.acm.org/10.1145/566570.566643]
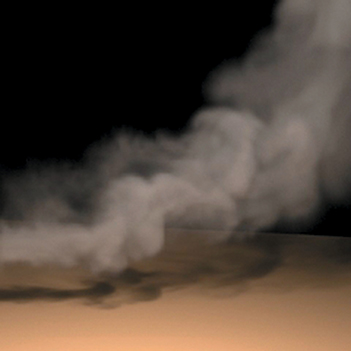
FIGURE 14.10 Blowing smoke
Reproduced Ronald Fedkiw, et. al., “Visual Simulation of Smoke.” SIGGRAPH (2001): 15-22. © 2001 AMC, Inc. Reprinted by permission. [http://doi.acm.org/10.1145/383259.383260]
Cloth comes in two main types—woven and knit. Woven cloth has two sets of threads that are perpendicular. When cloth is woven, some of the vertical threads are up and some are down when a horizontal thread is passed between them. The set of threads that are up and down are changed before the next horizontal thread is added. The colors of the threads and the identities of which are up and down combine to create a pattern in the resulting fabric. Woven cloth can stretch, but only a little, depending on the threads and weaving pattern used. In contrast, knit cloth is created with one long thread or yarn that is interlocked using a series of loops. A pattern is created in knit cloth by the way that the yarn twists and turns within the loops. Knit cloth is very stretchy and easily deforms around objects.
Cloth that is laying flat isn’t very interesting, but the way that cloth moves and drapes is interesting from a graphics standpoint. Modeling the drape of woven cloth can be done simply by looking at the shapes of the threads that make up the cloth. Because of gravity, a rope hanging between two posts takes on a shape known as a catenary curve. Modeling a cloth lying over two posts can be done by having the underlying threads form a catenary curve. The challenge is to make sure the cloth doesn’t intersect with itself or with other objects—a challenge handled by using constraint techniques to make sure that in the calculations the cloth doesn’t intersect something. Other techniques are used to untangle the cloth in situations where the first set of calculations can’t prevent the intersection. FIGURE 14.11 shows an example of cloth that is draping and folded.
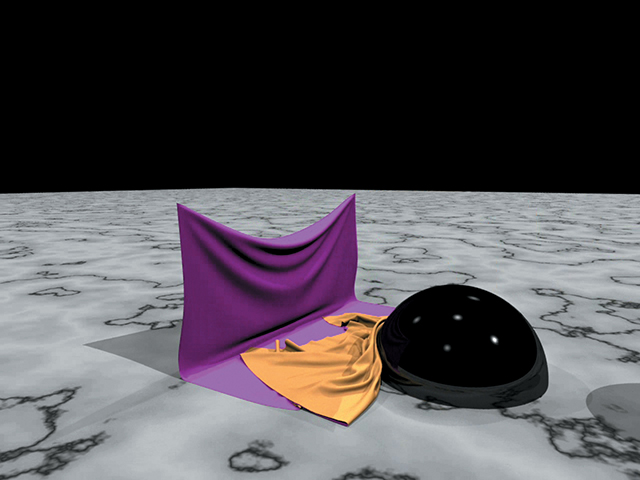
FIGURE 14.11 A simulation of cloth showing bending and draping
Courtesy of Robert Bridson. © 2004 Robert Bridson
Knit cloth poses an entirely different set of problems because as it drapes, the cloth will stretch. This stretch deforms the loops that form the cloth. Furthermore, because knit cloth uses larger yarns, shadows will form in the fabric as the yarn blocks light from another part of the cloth. The thickness and fuzziness of the yarn also influence the cloth’s appearance. One graphics technique for depicting knit cloth treats the path of the yarn in the cloth as a long curve. Points on the curve are associated with points on a plane to model the knit fabric at rest. To place the fabric on an object, the plane is deformed to the shape of the object. The deformation of the plane changes the locations of the points on the curve. The new locations of these points reflect where the knit fabric stretches and bends. Rendering the fabric then becomes a matter of rendering the yarn as it travels along the now deformed curve.
Skin requires special graphics techniques to handle both its shape and its appearance. Skin is soft and has a shape that depends on the underlying muscles and bone. As muscles contract and relax, our body shape changes and thus our skin will deform. Skin also stretches, wrinkles, and creases as our joints move. In graphics, an advanced technique called implicit surfaces can be used to model the shape of skin. For example, the equation for a sphere (x2 + y2 + z2 = r2) does not explicitly give the x, y, and z values that are on the surface of the sphere. Rather, we can try different values for x, y, and z until we find the ones that satisfy this equation for a given radius. Thus we implicitly find the points on the surface of the sphere. For skin, an even more complex set of equations is used to specify the implicit surface.
Once the shape of the skin is determined, skin must be rendered differently than most other objects. When light strikes the skin, some of the light reflects off the oils on the skin and the rest of the light actually penetrates the top layers of skin. The light that penetrates the skin will reflect off lower layers, pigment particles, and blood before emerging from the skin. If you look at your hand, you will probably notice that you clearly see the outer surface but that you also see underlying blood vessels and maybe even freckles. To accurately render skin, the graphics application must account for this subsurface scattering of light. Subsurface scattering must also be handled to accurately render marble and food products such as milk.
Getting Things to Move
So far, we have been talking about graphics from the perspective of a single image, but games and animated films require many images. A film uses 24 images per second and video uses 30 images per second. These images are shown rapidly, so that we perceive the changes between images as continuous motion. A 60-minute animated film requires 86,400 images and a 60-minute video requires 108,000 images. The work done for each individual image is the same even though that image is now part of a sequence of images.
Animation does pose a new challenge, however, if we want to create believable movement of objects. Deciding how to change the positions of objects between the images must be done carefully if the movement is to look realistic. In some cases, realistic movement can be generated based on physical properties. For example, if a ball is thrown into the air, we can predict how it will slow down and stop before falling to the ground based on the laws of gravity.
Having an object move from point A to point B in 10 seconds is not as simple as dividing the distance into 299 equal changes for the 300 images needed for the 10-second video. That result will not look realistic because when objects move there is a period during which their speed is increasing, called the ease-in in animation. During the ease-in, the object will move in smaller but increasing amounts between each frame. Also, the object will not come to a sudden stop, but rather will slow down until stopped, which is called the ease-out in animation. As a consequence, the change in distance for the ending images will get smaller with each additional image.
Animating figures is even more complex. We are very familiar with the movements of humans and animals, so even small problems in motion will obviously look unnatural. We are so good at recognizing motion of figures that we can recognize that someone in the distance is a friend by the way the person walks, even if he or she is not close enough for us to recognize the face. We can also sometimes identify someone approaching us, even if we merely hear the sounds of their footsteps.
Consider the process of having a character reach for an object. When we reach for something, the entire arm moves. If the object is just out of reach, the shoulder will move and the upper body will either bend at the waist or twist around the waist. To do this, the positioning of all of the arm segments and joints changes. Animating a character to reach could be done by determining where the hand needs to be and then determining what angles the joints should be for the hand to get to its destination. Over the length of the animation, we can change the joint angles from their starting values to the final values. Although this approach would deliver the motion needed, the result might not look realistic. This process becomes even more complex if we have to calculate a path of motion to avoid other objects in the scene.
Graphics researchers are using information gleaned through the study of human and animal motion to develop systems that can automatically generate more natural motion. There is, however, a way to cheat—motion capture. In motion capture, sensors are placed at significant locations on a person’s body. The human then moves the way that the character is supposed to move. The location of the sensors is tracked during the entire motion. The sensor locations indicate where the equivalent part of the character should be during the movement. In this way, the sensor locations tell the graphics application where the character should be positioned for each of the images of the animation. This technique works well for film animation because the character movement is known. It doesn’t work for computer games, where the movement of the character depends on what is occurring in the game.
In our day-to-day lives, we do many things without thinking about them. We see objects without thinking about the way they are illuminated by light. We move ourselves and objects without thinking about the locations of our joints or how to avoid hitting other objects. But when it comes to computer graphics, we have to think about all of these concerns because we have to write computer programs to create images showing just these sorts of things.