Note 73. Estimating Coefficients for Autoregressive Models: Burg Algorithm
The Burg algorithm [1, 2] is a technique for fitting an AR model to a signal that is represented by a sequence of N measured samples, x[0] through x[N –1]. What sets the Burg method apart from other techniques for estimating AR model parameters are the assumptions made about signal values x[n] for n > 0 and for n ≥ N. The autocorrelation method described in Note 70 assumes that unknown values of x[n] are zero. The covariance method described in Note 71 makes no assumptions about unknown values for x[n], but uses an optimization strategy that is structured to use only the N measured values. FFT-based methods assume the same periodic extension of values that is implicit in the DFT. The Burg method does not make any upfront assumptions about the unknown values for x[n], but instead adopts values that do not add any information or entropy to the signal. For this reason, Burg’s method is sometimes called the maximum entropy method (MEM), and spectrum analysis using Burg’s method is sometimes called maximum entropy spectrum analysis (MESA).
The strategy of the algorithm is to characterize the AR model in terms of reflection coefficients for the equivalent lattice filter implementation. The Burg method is distinguished from other methods using a similar strategy by the optimization criteria used in estimating the coefficients. In Burg’s method, the reflection coefficients are computed sequentially using a variant of the Levinson recursion to minimize, at each stage, the sum of the forward and backward prediction error powers.
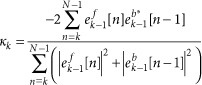
Specifically, the Burg algorithm computes the reflection coefficient, κk, as
73.1
Recipe 73.1. Burg Algorithm for AR Coefficient Estimation
- Initialize:
- For k = 1, 2, . . ., p compute
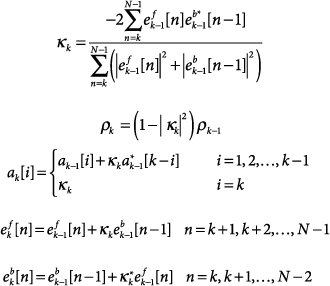
- The coefficients κk for k = 1, 2, . . ., p are the desired result for a lattice filter implementation. The coefficients ap[i] for i = 1, 2, . . ., p are the desired result for an IIR implementaion.
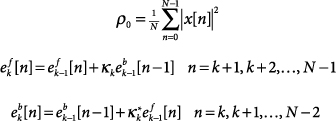
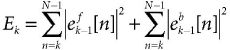
where the forward estimation error and backward estimation error at each stage are obtained from results of the prior stage as
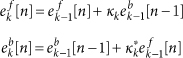
Assuming that values for κ1, κ2, . . ., κk–1 have been selected and remain fixed, the value for κk computed by Eq. (73.1) minimizes the stage k error, which is given by
Derivations showing that coefficients computed by Eq. (73.1) do in fact minimize Ek can be found in [3] and [4].
Using the reflection coefficients obtained from Eq. (73.1), the coefficients for an AR filter implementation can be obtained recursively (in model order) as
73.2
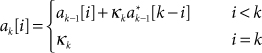
where k denotes the model order, and i is the delay index of the particular coefficient. A filter constructed using these coeffcients will be both stable and minimum-phase.
The complete Burg algorithm is provided in Recipe 73.1.
73.1. Line Splitting
It has been observed [5] that AR spectra produced using the Burg algorithm sometimes exhibit line splitting, a phenomenon in which a signal component at a single frequency gives rise to spectral lines at several closely-spaced but distinct frequencies. Line splitting is most likely to occur under the following conditions:
- The signal-to-noise ratio (SNR) is high.
- The initial phase of sinusoidal signal component(s) is an odd multiple of π/4.
- The signal segment used for estimating the AR coefficients contains an odd number of quarter cycles for sinusoidal signal components.
- The number of AR coefficients being estimated is a large fraction of the number of samples in the signal segment being used for estimating the AR coefficients.
References
1. J. P. Burg, “Maximum entropy spectral analysis,” Proc. 37th Meeting, Society of Exploration Geophysics, 1967. Reprinted in Modern Spectrum Analysis, IEEE Press, 1978.
2. J. P. Burg, “Maximum entropy spectral analysis,” Ph.D. dissertation, Dept. Geophysics, Stanford University, Stanford, Calif., May 1975.
3. M. H. Hayes, Statistical Digital Signal Processing and Modeling, Wiley, 1996.
4. S. L. Marple, Digital Spectral Analysis with Applications, Prentice Hall, 1987.
5. P. F. Fougere, E. J. Zawalick, H. R. Radoski, “Spontaneous line splitting in maximum entropy power spectrum analysis,” Phys. Earth and Planetary Interiors, vol. 12, August 1976, pp. 201–207.
6. S. L. Marple, “A new autoregressive spectrum analysis algorithm,” IEEE Trans. ASSP, vol. 28, August 1980, pp. 441–454.