
2.4. Model Building
This section discusses model building with the %Boost macro introduced in Section 2.3.
Each modification of the AdaBoost algorithm (AdaBoost, Real AdaBoost, Gentle AdaBoost and LogitBoost) performs differently on various types of data. Because of this fact, we should evaluate the performance of each model on a training and testing set to identify the model with the best performance. For the permeability data, Program 2.9 performs each version of boosting on the training and testing sets (TRAIN and TEST data sets) created in Program 2.7. The program also computes and plots the associated misclassification errors to gauge the predictive ability of each model.
Example 2-9. Performance of the four boosting algorithms in the permeability data example
* AdaBoost;
%boost(inputds=train,p=71,outputds=adaout1,outwts=adawt1,iter=40,type=1);
%predict(pred_ds=test,p=71,boost_ds=adaout1,outputds=adatst1,out_pred=adapred1,
    type=1,iter=40);
* Real AdaBoost;
%boost(inputds=train,p=71,outputds=realout1,outwts=realwt1,iter=40,type=2);
%predict(pred_ds=test,p=71,boost_ds=realout1,outputds=realtst1,out_pred=realpred1,
    type=2,iter=40);
* Gentle AdaBoost;
%boost(inputds=train,p=71,outputds=genout1,outwts=genwt1,iter=40,type=3);
%predict(pred_ds=test,p=71,boost_ds=genout1,outputds=gentst1,out_pred=genprd1,
    type=3,iter=40);
* LogitBoost;
%boost(inputds=train,p=71,outputds=logout1,outwts=logwt1,iter=40,type=4);
%predict(pred_ds=test,p=71,boost_ds=logout1,outputds=logtst1,out_pred=logprd1,
    type=4,iter=40);
* Training set misclassification errors;
data adaout1;
    set adaout1; method=1;
data realout1;
set realout1; method=2;
data genout1;
set genout1; method=3;
data logout1;
set logout1; method=4;
data train_error;
set adaout1(keep=iter error method)
realout1(keep=iter error method)
genout1(keep=iter error method)
logout1(keep=iter error method);
axis1 minor=none label=(angle=90 "Error") order=(0 to 0.3 by 0.1) width=1;
axis2 minor=none label=("Iteration") order=(1 to 41 by 10) width=1;
symbol1 i=join value=none color=black line=1 width=3;
symbol2 i=join value=none color=black line=34 width=3;
symbol3 i=join value=none color=black line=20 width=3;
symbol4 i=join value=none color=black line=41 width=3;
proc gplot data=train_error;
plot error*iter=method/vaxis=axis1 haxis=axis2 frame nolegend;
run;
quit;
* Test set misclassification errors;
data adatst1;
set adatst1; method=1;
data realtst1;
set realtst1; method=2;
data gentst1;
set gentst1; method=3;
data logtst1;
set logtst1; method=4;
data test_error;
set adatst1(keep=iter error method)
realtst1(keep=iter error method)
gentst1(keep=iter error method)
logtst1(keep=iter error method);
axis1 minor=none label=(angle=90 "Error") order=(0.2 to 0.5 by 0.1) width=1;
axis2 minor=none label=("Iteration") order=(1 to 41 by 10) width=1;
symbol1 i=join value=none color=black line=1 width=3;
symbol2 i=join value=none color=black line=34 width=3;
symbol3 i=join value=none color=black line=20 width=3;
symbol4 i=join value=none color=black line=41 width=3;
proc gplot data=test_error;
plot error*iter=method/vaxis=axis1 haxis=axis2 frame nolegend;
run;
quit; |
Figure 2-6. Misclassification rates the training (left panel) and test (right panel) subsets of the PERMY data set (solid curve, AdaBoost; dotted curve, Real AdaBoost; dashed curve, Gentle AdaBoost; dashed-dotted curve, LogitBoost)

The misclassification error curves for the four boosting algorithms are displayed in the left panel of Figure 2.6. After 40 iterations, each method has learned as much information as possible about the structure of the training set in relation to compound permeability classification (notice the flattening of each misclassification curve). Thesemodels are subsequently applied to the test set and the resulting misclassification error curves are shown in the right panel of Figure 2.6. This plot demonstrates that the predictive ability of boosting does not improve as the number of iterations increases. Notice, however, that boosting does not rapidly overfit; the test set error does not climb rapidly as iteration number increases.
As mentioned in the previous section, boosting will focus its modeling efforts on observations that are difficult to classify by increasing the observations' weights. The original classification of compounds in this data set is inherentlynoisy, which could be causing boosting to focus on incorrect features of the data in an attempt to classify all observations. Program 2.10 computes and plots the Real AdaBoost weights of each observation after 40 iterations.
Example 2-10. Observation weights for the Real AdaBoost algorithm
%boost(inputds=train,p=71,outputds=realout1,outwts=realwt1,iter=40,type=2);
* Weights from Real AdaBoost;
proc sort data=realwt1 out=sortwts;
    by descending weight;
data sortwts;
    set sortwts;
    obsnum=_n_;
* Vertical axis;
axis1 minor=none label=(angle=90 "Weight") order=(0 to 0.03 by 0.01) width=1;
* Horizontal axis;
axis2 minor=none label=("Observations") order=(0 to 225 by 25) width=1;
symbol1 i=none value=circle color=black height=4;
proc gplot data=sortwts;
    plot weight*obsnum/vaxis=axis1 haxis=axis2 frame;
    run;
quit; |
Figure 2-7. Observation weights for the Real AdaBoost algorithm after 40 iterations (observations are ordered by magnitude)
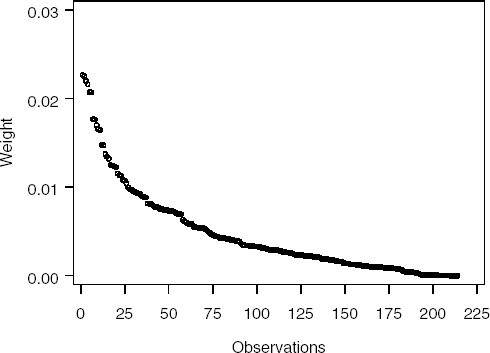
Figure 2.7 displays the weights computed by Program 2.10. In this example, the Real AdaBoost algorithm focuses 50 percent of the weight on only 20 percent of the data—a telltale sign that boosting is chasing misclassified or difficult-to-classify observations.
In an attempt to find a predictive model, we have removed these observations and have re-run each boosting algorithm (Program 2.11). The misclassification error curves generated by Program 2.11 are displayed in Figure 2.8.
Example 2-11. Performance of the four boosting algorithms in the permeability data example (reduced data set)
* Real AdaBoost;
%boost(inputds=train,p=71,outputds=realout1,outwts=realwt1,iter=40,type=2);
data newtrain;
    merge train realwt1;
    if weight>0.007 then delete;
    drop weight;
* AdaBoost;
%boost(inputds=newtrain,p=71,outputds=adaout2,outwts=adawt2,iter=40,type=1);
%predict(pred_ds=test,p=71,boost_ds=adaout2,outputds=adatst2,out_pred=adapred2,
    type=1,iter=40);
* Real AdaBoost;
%boost(inputds=newtrain,p=71,outputds=realout2,outwts=realwt2,iter=40,type=2);
%predict(pred_ds=test,p=71,boost_ds=realout2,outputds=realtst2,out_pred=realpred2,
    type=2,iter=40);
* Gentle AdaBoost;
%boost(inputds=newtrain,p=71,outputds=genout2,outwts=genwt2,iter=40,type=3);
%predict(pred_ds=test,p=71,boost_ds=genout2,outputds=gentst2,out_pred=genprd2,
    type=3,iter=40);
* LogitBoost;
%boost(inputds=newtrain,p=71,outputds=logout2,outwts=logwt2,iter=40,type=4);
%predict(pred_ds=test,p=71,boost_ds=logout2,outputds=logtst2,out_pred=logprd2,
    type=4,iter=40);
* Training set misclassification errors;
data adaout2;
    set adaout2; method=1;
data realout2;
    set realout2; method=2;
data genout2;
    set genout2; method=3;
data logout2;
    set logout2; method=4;
data train_error2;
set adaout2(keep=iter error method)
realout2(keep=iter error method)
genout2(keep=iter error method)
logout2(keep=iter error method);
axis1 minor=none label=(angle=90 "Error") order=(0 to 0.3 by 0.1) width=1;
axis2 minor=none label=("Iteration") order=(1 to 41 by 10) width=1;
symbol1 i=join value=none color=black line=1 width=3;
symbol2 i=join value=none color=black line=34 width=3;
symbol3 i=join value=none color=black line=20 width=3;
symbol4 i=join value=none color=black line=41 width=3;
proc gplot data=train_error2;
plot error*iter=method/vaxis=axis1 haxis=axis2 frame nolegend;
run;
quit;
* Test set misclassification errors;
data adatst2;
set adatst2; method=1;
data realtst2;
set realtst2; method=2;
data gentst2;
set gentst2; method=3;
data logtst2;
set logtst2; method=4; run;
data test_error2;
set adatst2(keep=iter error method)
realtst2(keep=iter error method)
gentst2(keep=iter error method)
logtst2(keep=iter error method);
axis1 minor=none label=(angle=90 "Error") order=(0.2 to 0.5 by 0.1) width=1;
axis2 minor=none label=("Iteration") order=(1 to 41 by 10) width=1;
symbol1 i=join value=none color=black line=1 width=3;
symbol2 i=join value=none color=black line=34 width=3;
symbol3 i=join value=none color=black line=20 width=3;
symbol4 i=join value=none color=black line=41 width=3;
proc gplot data=test_error2;
plot error*iter=method/vaxis=axis1 haxis=axis2 frame nolegend;
run;
quit; |
Figure 2-8. Misclassification rates in the training (left panel) and test (right panel) subsets for the reduced training set (solid curve, AdaBoost; dotted curve, Real AdaBoost; dashed curve, Gentle AdaBoost; dashed-dotted curve, LogitBoost)

Figure 2.8 depicts the misclassification error curves for the four boosting algorithms in the reduced data set. The initial training error is lower than for the original training set (see Figure 2.6), and each boosting method more rapidly learns the featuresof the training data that are related to permeability classification. This implies that the observations that were removed from the training set were likely misclassified but the predictive performance on the test set does not improve (see the right panel of Figure 2.8).
Undoubtedly, the test set also contains observations that are misclassified. In a final attempt to improve boosting's predictive ability, we have run Real AdaBoost on thetest set and have removed the highest weighted observations. To this reduced test set, we have applied each reduced training set boosting model (Program 2.12). The misclassification error rates computed by the program are shown in Figure 2.9.
Example 2-12. Predictive performance of the four boosting algorithms in the permeability data example (reduced data set)
* Model test set data and identify compounds with high weights;
%boost(inputds=test,p=71,outputds=realout3,outwts=realwt3,iter=40,type=1);
data newtest;
    merge test realwt3;
    if weight>0.01 then delete;
    drop weight;
* AdaBoost;
%predict(pred_ds=newtest,p=71,boost_ds=adaout2,outputds=adatst3,out_pred=adapred3,
    type=1,iter=40);
* Real AdaBoost;
%predict(pred_ds=newtest,p=71,boost_ds=realout2,outputds=realtst3,out_pred=realpred3,
    type=2,iter=40);
* Gentle AdaBoost;
%predict(pred_ds=newtest,p=71,boost_ds=genout2,outputds=gentst3,out_pred=genprd3,
    type=3,iter=40);
* LogitBoost;
%predict(pred_ds=newtest,p=71,boost_ds=logout2,outputds=logtst3,out_pred=logprd3,
    type=4,iter=40);
* Test set misclassification errors;
data adatst3;
    set adatst3; method=1;
data realtst3;
    set realtst3; method=2;
data gentst3;
    set gentst3; method=3;
data logtst3;
    set logtst3; method=4;
data test_error3;
    set adatst3(keep=iter error method)
    realtst3(keep=iter error method)
    gentst3(keep=iter error method)
    logtst3(keep=iter error method);
axis1 minor=none label=(angle=90 "Error") order=(0 to 0.3 by 0.1) width=1;
axis2 minor=none label=("Iteration") order=(1 to 41 by 10) width=1;
symbol1 i=join value=none color=black line=1 width=3;
symbol2 i=join value=none color=black line=34 width=3;
symbol3 i=join value=none color=black line=20 width=3;
symbol4 i=join value=none color=black line=41 width=3;
proc gplot data=test_error3;
plot error*iter=method/vaxis=axis1 haxis=axis2 frame nolegend;
run;
quit; |
Figure 2-9. Misclassification error rates in the test subset of the reduced set (solid curve, AdaBoost; dotted curve, Real AdaBoost; dashed curve, Gentle AdaBoost; dashed-dotted curve, LogitBoost)

Figure 2.9 demonstrates that the misclassification error rates on this set are noticeably lower than on the original test set.
While boosting does not significantly reduce test set classification error across iterations for this example, it does allow the user to identify difficult-to-classify, or possibly misclassified observations. With these observations present, any method will have a difficult time finding the underlying relationship between predictors and response.