
4.5. Accuracy and Precision
4.5.1. Accuracy (Trueness)
The accuracy (the preferred term is trueness), of an analytical procedure, according to ICH and related documents, expresses the closeness of agreement between the mean value obtained from a series of measurements and the value which is accepted either as a conventional true value or an accepted reference value (e.g., international standard, standard from a pharmacopoeia). It is a measure of the systematic error of test results obtained by the analytical method from its theoretical true/reference value. The measure of trueness is generally expressed in terms of recovery and absolute/relative bias.
Note that "accuracy" is synonymous with bias or trueness only within the pharmaceutical set of regulations covered by ICH (and related national documents implementing ICH Q2A and Q2B). Outside the pharmaceutical industry, e.g., in industries covered by the International Organization for Standardization or National Committee for Clinical Laboratory Standards guidelines (food, chemistry, clinical biology, and other industries), "accuracy" refers to the total error, i.e., the sum of trueness and precision.
4.5.2. Precision
The precision of an analytical procedure is defined by the closeness of agreement (usually expressed as standard deviation or coefficient of variation) between a series of measurements obtained from multiple sampling of the same homogeneous sample (independent assays) under the prescribed conditions. The term "independent results" means that the results are obtained and prepared the same way that unknown samples will be quantified and prepared.
Precision provides information on random errors and can be evaluated at three levels: repeatability, intermediate precision (within laboratory) and reproducibility (between laboratories). The precision only represents the distribution of the random errors and is not related to the true or specified value. A measure of precision is calculated from the standard deviation of the results.
Quantitative measures of precision depend in a critical manner on stipulated conditions. One can distinguish among the following three conditions:
Repeatability. Repeatability expresses the precision under conditions where the results of independent assays are obtained by the same analytical procedure on identical samples in the same laboratory, with the same operator, using the same equipment and during a short interval of time. It is estimated by the within-series variance component.
Intermediate precision. Intermediate precision expresses the precision under conditions where the results of independent assays are obtained by the same analytical procedure on identical samples in the same laboratory, with different operators, using different equipment and during a given time interval. It is estimated by the sum of within-series and between-series variance components. Intermediate precision is representative of the total random error for a single measurement within a laboratory, whatever the day or series.
Reproducibility. Reproducibility expresses the precision under conditions where the results are obtained by the same analytical procedure on identical samples in different laboratories, with different operators and using different equipment. It is estimated by the sum of within-series, between-series and between-laboratories variance components.
4.5.3. Total Error or Measurement Error
The measurement error of an analytical procedure is related to the closeness of agreement between the value found and the value that is accepted either as a conventional true value or an accepted reference value. The closeness of agreement observed is based on the sum of the systematic and random errors; in other words, the total error linked to the result. Consequently, the measurement error is the expression of the sum of the trueness and precision, i.e., the total error.
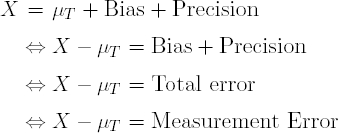
As shown below, the observation X is a result of the true sample value μT, the method's Bias (estimated by the mean of many results) and Precision (estimated by the standard deviation or, in most cases, the Intermediate Precision). Equivalently, the difference between an observation X and the true value is the sum of the systematic and random errors, i.e., Total Error or Measurement Error.
4.5.4. Computational Aspects
As described in Section 4.1, the classical design of a pre-study validation consists in performing different runs with replicates in each run. Let's note p the number of runs, ni the number of replicates in the ith run, N = n1 + ... + np the total number of measurements, and xij is the jth measurement in the ith run.
Validation criteria such as accuracy and precision are estimated for each concentration level by statistical analysis of the back-calculated quantities. Computationally, a one-factor random effects Analysis of Variance (ANOVA) model is fit to the back-calculated values at each level with run as the random effects factor:
where μ is the mean of calculated concentrations, αi and εij are normally distributed with mean 0 and variances σ2B and σ2W, respectively. Here σ2B is the run-to-run variance and σ2W is the within-run variance. The estimates of μ, σ2B and σ2W are given by:

where ![]() i = ni−1 Σj=1nixij and
i = ni−1 Σj=1nixij and ![]() = N−1 Σi=1pni. By definition, the estimate of the within-run variance corresponds to the variance of repeatability and the sum of the within-run and run-to-run components corresponds to the intermediate precision. That is, the intermediate precision variance is σ2B + σ2W.
= N−1 Σi=1pni. By definition, the estimate of the within-run variance corresponds to the variance of repeatability and the sum of the within-run and run-to-run components corresponds to the intermediate precision. That is, the intermediate precision variance is σ2B + σ2W.
The relative error (RE), the coefficient of variation of the intermediate precision (CVIP) and the total error (TE) are calculated as follows:
Program 4.7 utilizes these formulas to compute the accuracy, precision and total error performance parameters. In this example, each combination of series and plate is considered as a run. Again, this program uses the CALC_CONC data set created in Program 4.5.
Example 4-7. Computation of the accuracy and precision parameters
proc sort data=calc_conc;
    by concentration;
proc mixed data=calc_conc;
    class run;
    model calc_conc=/solution;
    random run;
    by concentration;
    ods output dimensions=dim;
    ods output solutionf=solf;
    ods output CovParms=var_comp;
proc sort data=calc_conc;
    by concentration run plate;
proc univariate data=calc_conc noprint;
    var calc_conc;
    by concentration run;
    output out=stat_by_conc_run n=n;
proc sql;
    create table stat_by_conc as
    select t1.concentration, cap_n, sum_n_sq/cap_n as n, n_run, mean,
         sqrt(sigma_w_sq) as sigma_w,
         100*sqrt(sigma_w_sq)/t1.concentration as cv_w,
         sqrt(sigma_b_sq) as sigma_b,
         100*sqrt(sigma_b_sq)/t1.concentration as cv_b,
         sqrt(sigma_w_sq+sigma_w_sq) as sigma_t,
         100*sqrt(sigma_w_sq+sigma_w_sq)/t1.concentration as cv_t
    from (select concentration, value as cap_n from dim where
         descr='Observations Used') as t1,
         (select concentration, estimate as mean from solf) as t2,
         (select concentration, sum(n**2) as
         sum_n_sq from stat_by_conc_run group by concentration) as t3,
         (select concentration, estimate as sigma_b_sq from var_comp
         where covparm='run') as t4,
         (select concentration, estimate as sigma_w_sq from var_comp
         where covparm='Residual') as t5,
         (select count(run) as n_run from (select distinct run from
         stat_by_conc_run)) as t6 where t1.concentration=t2.concentration=
         t3.concentration=t4.concentration=t5.concentration;
    run;
    quit;
* Calculation of validation criteria;
data stat_by_conc;
    set stat_by_conc;
    format mean re cv_w cv_b cv_t te 4.1 low_tol_lim_rel upp_tol_lim_rel 5.1;
    re=100*(mean-concentration)/concentration;
    te=abs(re)+cv_t;
    r=(sigma_b/sigma_w)**2;
    b=sqrt((r+1)/(n*r+1));
    ip=sigma_b**2+sigma_w**2;
    ddl=((r+1)**2)/(((r+1/n)**2)/(n_run-1)+(1-1/n)/(cap_n));
    low_tol_lim_abs=mean-tinv(0.975,ddl)*sqrt(ip*(1+1/(cap_n*b**2)));
    upp_tol_lim_abs=mean+tinv(0.975,ddl)*sqrt(ip*(1+1/(cap_n*b**2)));
    low_tol_lim_rel=(low_tol_lim_abs-concentration)*100/concentration;
    upp_tol_lim_rel=(upp_tol_lim_abs-concentration)*100/concentration;
label concentration='Nominal*concentration'
mean='Calculated*concentration'
re='Relative*error (%)'
cv_w='Within-run*CV (%)'
cv_b='Run-to-run*CV (%)'
cv_t='Intermediate*precision*CV (%)'
te='Total*error(%)'
low_tol_lim_rel='Upper 95%*tolerance*limit'
upp_tol_lim_rel='95% TI*upper*limit';
proc print data=stat_by_conc noobs split='*';
format mean re cv_w cv_b cv_t te 4.1 low_tol_lim_rel upp_tol_lim_rel 5.1;
var concentration mean re cv_w cv_b cv_t te;
run; |
Example. Output from Program 4.7
Intermediate
     Nominal     Calculated   Relative  Within-run Run-to-run  precision    Total
  concentration concentration error (%)   CV (%)     CV (%)      CV (%)    error(%)

        3.5          3.2        −7.3       37.7       23.0        53.3       60.6
        7.0          8.2        16.6       14.7       18.5        20.8       37.5
       14.1         15.5         9.8       12.7        8.8        18.0       27.8
       28.0         30.0         7.3        4.3        5.2         6.1       13.4
       56.0         57.9         3.3        2.7        5.3         3.9        7.2
      113.0          114         1.0        2.4        6.2         3.4        4.3
      225.0          235         4.6        3.7        4.5         5.2        9.8
450.0 469 4.1 5.5 5.0 7.7 11.9 |
Output 4.7 shows the estimates of the main accuracy, precision and total error performance parameters of the method as a function of the estimated concentration. It is clear that, at low concentration levels (less than or equal to 14.1 μM), either the trueness or precision is not acceptable. This is well summarized by the total error that becomes smaller than 30% for concentration values greater than 14.1 μM. This already gives an idea about the capability of the method, but as it will be shown in the following section, the decision rule should be established on a more refined method that takes the notion of risk into consideration.