
11.1. Introduction
Dose-ranging studies are conducted at early stages of drug development (both pre-clinical and clinical stages) to evaluate safety and efficacy of experimental drugs. A large number of publications deal with the analysis of dose-ranging studies designed to test several doses (or dose regimens) of an experimental drug versus a control. This area of research is commonly referred to as dose-response analysis covers the relationship between dose and clinical response.
There are several distinct research topics within dose-response analysis (Ruberg, 1995a):
Assessment of the dose-related trend in the response variable.
Estimation of the shape of the dose-response function.
Determination of optimal doses (including identification of the minimum effective dose which is of increasing concern as safety issues arise with marketed products).
The three objectives of dose-response analysis are obviously intertwined; however, it is generally prudent to examine them one at a time.
First, before making a decision to invest more research dollars in an experimental drug, drug developers need to ensure that a drug effect, manifested by a positive dose-response relationship, is present. A positive dose-response relationship, defined as a non-decreasing shape in the response variable from the lowest dose to the highest dose, plays a key role in early drug evaluation. As pointed out by Kodell and Chen (1991), "evidence of a dose-response relationship is taken to be a more compelling finding than evidence of a positive effect that does not appear to be dose-related'.
Once it has been demonstrated that an overall dose-related trend is present, one needs to characterize the dose-response function and determine efficacious and safe doses. To understand the importance of this step, note that a significant overall trend is rarely accompanied by significant treatment differences at all dose levels. In most cases, significant treatment differences are observed only at some doses included in a dose-ranging study and it is critical to identify the range of doses over which a positive dose-response is truly present. This information is used to determine a therapeutic window (a contiguous interval within which every dose is safe and effective) and will ultimately guide the selection of doses for registration studies.
Dose-response testing and modeling have received much attention in the clinical trial literature. For a general overview of issues arising in dose-response studies and a discussion of relevant statistical methods, see Ruberg (1995a, 1995b), Chuang-Stein and Agresti (1997) and Phillips (1997, 1998). Also, Westfall et al. (1999, Section 8.5) provide an overview of dose-finding methods in clinical trials with a large number of SAS examples.
This chapter summarizes popular statistical methods used in dose-response analysis, e.g., trend tests, dose-response models and dose-finding strategies based on multiple tests. The statistical procedures introduced in this chapter are illustrated using examples from dose-ranging clinical trials.
11.1.1. Clinical Trial Examples
To illustrate the dose-response tests and models that will be introduced in this chapter, we will use the following three clinical trials examples. The first one is a cross-over trial representative of trials conducted at early stages of clinical development. The other two trials use a parallel group design and serve as examples of dose-ranging Phase II or Phase III trials.
11.1.2. Clinical Trial in Diabetes Patients (Cross-Over Design)
A Phase I study in patients with Type II diabetes was conducted to test four doses of an experimental drug versus placebo using a cross-over design with two periods. Patients enrolled into the study were assigned to one of four groups (six patients to each group). Each group of patients received 24-hour placebo and experimental drug infusions on two occasions. The primary pharmacodynamic objective of the study was to examine effects of the selected doses on fasting serum glucose. Specifically, the primary pharmacodynamic endpoint was defined as the fasting serum glucose concentration at the end of a 24-hour infusion.
Figure 11.1 displays the dose-response relationship observed in the diabetes trial. The mean fasting serum glucose level decreases as the infusion rate increases in a monotone fashion. The mean glucose levels are based on least square means computed from a mixed model with a fixed group effect and a random subject effect.
Figure 11-1. Fasting serum glucose level in the diabetes trial example

The data set with fasting serum glucose measurements (DIABETES data set) can be found on the book's companion Web site.
To save space, some SAS code has been shortened and some output is not shown. The complete SAS code and data set used in this book are available on the book's companion Web site at http://support.sas.com/publishing/bbu/companion_site/60622.html.
11.1.3. Clinical Trial in Patients with Asthma (Parallel Group Design)
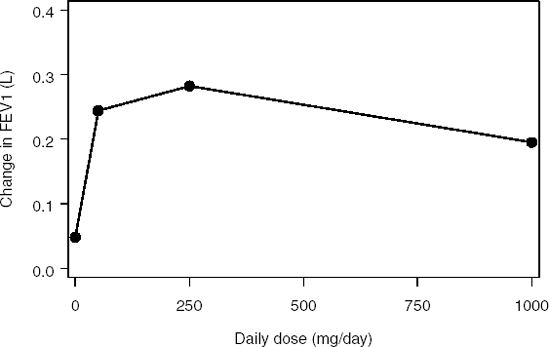
A Phase II trial in 108 patients with mild to moderate asthma was conducted to compare three doses of an experimental drug to placebo. The drug was administered daily (50, 250 and 1000 mg/day). The efficacy of the experimental drug was studied using spirometry measurements. The primary efficacy endpoint was the forced expiratory volume in one second (FEV1).
Figure 11.2 displays the results of the trial. It shows the relationship between the mean FEV1 improvement (estimated using least square means) and daily dose in the asthma trial. The observed dose-response relationship is not monotone—this is an example of the so called umbrella-shaped relationship. The mean FEV1 improvement achieves its maximum at the medium dose (250 mg/day) and then drops to a lower value. The treatment effect at the high dose is even less than that at the low dose. Note, however, that the non-monotone trend depicted in Figure 11.2 may be due to sampling variability and the underlying dose-response relationship may still be positive. A statistical trend test is required to draw conclusions about the true dose-response curve.
Figure 11-2. Mean improvement in FEV1 in the asthma trial example
The data set with FEV1 measurements (ASTHMA data set) can be found on the book's companion Web site.
11.1.4. Clinical Trial in Patients with Hypertension (Parallel Group Design)
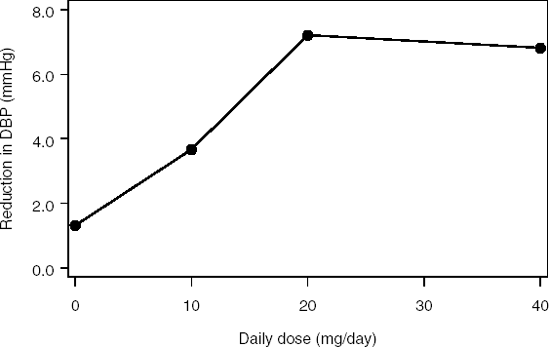
Consider a Phase II study in 68 patients with hypertension. The patients were randomly assigned to receive one of three doses of an antihypertensive drug (10, 20 or 40 mg/day) or placebo. The primary objective of the study was to examine the effect of the selected doses on diastolic blood pressure (DBP).
Figure 11.3 depicts the relationship between the mean reduction in diastolic blood pressure (based on least square means) and daily dose of the antihypertensive therapy. The overall dose-response trend is positive. The treatment effect seems to achieve a plateau at the 20 mg/day dose.
Figure 11-3. Mean reduction in diastolic blood pressure in the hypertension trial example
The data set with diastolic blood pressure measurements (HYPERTENSION data set) can be found on the book's companion Web site.
11.1.5. Overview
As was stated above, dose-response analysis plays an important role in both pre-clinical and clinical evaluation of compounds. Although some of the methods discussed below can be used in toxicological studies, this chapter focuses on a clinical setting which includes pharmacological studies and randomized clinical trials. See Chapter 5 for a brief overview of dose-response approaches used in toxicological studies. Also, this chapter deals mainly with continuous endpoints (contrast and some other tests can also be used with categorical variables). Chuang-Stein and Agresti (1997) give a general discussion of approaches to dose-response studies with categorical endpoints.
Section 11.2 outlines general principles that need to be considered in designing dose-ranging trials. The section describes issues arising in the design of dose-ranging studies and discusses the choice of research hypotheses in trials with negative and positive controls.
Section 11.3 discusses statistical procedures for addressing the first objective of dose-response analysis, i.e., procedures for testing dose-related trends. The section reviews both parametric and non-parametric methods. We also briefly discuss sample size calculations in dose-ranging trials based on general contrast tests (see Section 11.3.7).
Section 11.4 deals with the second objective—it briefly introduces regression-based approaches to examining the shape of dose-response functions, including methods based on linear and sigmoid models. Lastly, Section 11.5 considers the third objective of dose-response analysis and reviews approaches to finding the optimal dose based on multiple pairwise and treatment-control comparisons. This section introduces multiplicity adjustment procedures that are derived using the principles of closed and partition testing. It is worth noting that, in general, dose-response analyses are performed in Phase II trials and thus adjustments for multiplicity are not always considered. A strict control of the Type I error rate is mandated only in registration trials.