12.2. Case Studies
We will present three case studies which will be used throughout this chapter.
EXAMPLE: Exercise trial
In this heart failure study, the primary efficacy endpoint is based upon the ability to do physical exercise. This ability is measured in the number of seconds a subject is able to ride an exercise bike. The data collected in the study are included in the EXERCISE data set that can be found on the book's companion Web site. There are 25 subjects assigned to placebo (GROUP=0) and 25 to treatment (GROUP=1). The treatment consisted of the administration of ACE inhibitors. Four measurements were taken at monthly intervals (TIME variable). The Y variable represents the outcome scores transformed to normality.
All 50 subjects are observed at the first occasion, whereas there are 44, 41, and 38 subjects seen at the second, the third, and the fourth visits, respectively. Individual and mean response profiles per treatment arm are shown in Figures 12.1 and 12.2, respectively. The percentage of patients remaining in the study after each visit is tabulated in Table 12.1 per treatment arm.
| Visit | Placebo | Treatment |
|---|---|---|
| 1 | 100% | 100% |
| 2 | 88% | 88% |
| 3 | 84% | 80% |
| 4 | 80% | 72% |
EXAMPLE: Mastitis Data
This example, concerning the occurrence of the infectious disease mastitis in dairy cows, was introduced in Diggle and Kenward (1994) and reanalyzed in Kenward (1998). The MASTITIS data set, provided on the book's companion Web site, contains the milk yields (in thousands of liters) of 107 dairy cows from a single herd in two consecutive years: Yij (i = 1,...,107; j = 1,2). In the first year, all animals were supposedly free of mastitis; in the second year, 27 became infected. Mastitis typically reduces milk yield, and the question of scientific interest is whether the probability of occurrence of mastitis is related to the yield that would have been observed had mastitis not occurred. A graphical representation of the complete data is given in Figure 12.3.
Figure 12-1. Individual response profiles in the placebo (left panel) and treatment (right panel) groups in the exercise trial
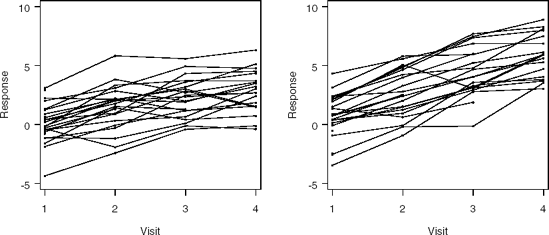
Figure 12-2. Mean response profiles in the placebo (solid curve) and treatment (dashed curve) groups in the exercise trial

Figure 12-3. Scatter plots of the Year 2 milk yield versus the Year 1 milk yield (left panel) the change in milk yield versus the Year 1 milk yield (right panel) in the mastitis example. Black dots represent Cows #4 and #5.

EXAMPLE: Depression trial
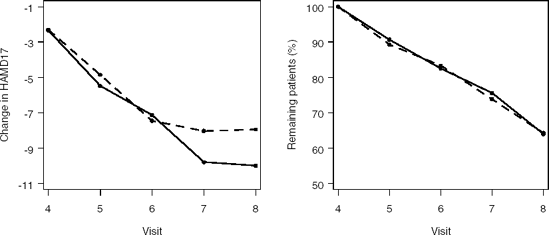
The DEPRESSION data set available on the book's companion Web site comes from a clinical trial including 342 patients with post-baseline data. The Hamilton Depression Rating Scale (HAMD17) is used to measure the depression status of the patients. For each patient, BASVAL represents the baseline HAMD17 assessment, Y is the HAMD17 score at Visits 4 through 8 and CHANGE is the change from baseline in the HAMD17 score at Visits 4 through 8. The YBIN variable is a binary outcome derived from the Y variable, i.e., Y=1 if the HAMD17 score is larger than 7, and 0 otherwise. Two treatment groups (primary dose of experimental drug, TRT=1, and placebo, TRT=4) are included in the data set.
Mean profiles of the HAMD17 changes and dropout rates in the two treatment groups are shown in Figure 12.4.
Figure 12-4. Left panel: Mean response profiles in Treatment groups 1 (solid curve) and 4 (dashed curve) in the depression trial. Right panel: Percentage of patients remaining in the study Treatment groups 1 and 4.