
4.4. Linearity
The linearity of an analytical procedure is defined in terms of its ability to obtain results directly proportional to the concentrations (quantities) of the analyte in the sample within a defined range (ICH, 1995). It is important to note that the linearity criterion is applied to the results, i.e., back-calculated quantities or concentrations, rather than the response signals or instrument response as a function of the dose or quantities.
To illustrate this concept, Program 4.6 performs a linearity assessment by comparing the original concentrations from the ELISA_VS data set to the corresponding back-calculated concentrations obtained in Program 4.5. This program uses the CALC_CONC data set created in Program 4.5. The results are displayed in Figure 4.4.
Example 4-6. Linearity assessment based on a 4-parameter logistic regression model
proc sql;
    create table linprof as
    select concentration, calc_conc, 't1' as type
           from calc_conc union
    select distinct concentration, concentration*0.7 as calc_conc, 't2' as type
           from calc_conc union
    select distinct concentration, concentration*1.3 as calc_conc, 't3' as type
           from calc_conc union
select distinct concentration, concentration as calc_conc, "t4' as type
from calc_conc;
run;
quit;
proc sort data=linprof;
by type concentration;
axis1 label=("Nominal concentration") order=(0 to 600 by 200);
axis2 label=(angle=90 "Calculated concentration") order=(0 to 600 by 200);
symbol1 value=circle i=none color=black height=5;
symbol2 value=none i=join color=black line=34 width=3;
symbol3 value=none i=join color=black line=34 width=3;
symbol4 value=none i=join color=black line=1 width=3;
proc gplot data=linprof;
plot calc_conc*concentration=type/haxis=axis1 vaxis=axis2 nolegend;
run;
quit; |
Figure 4-4. Linearity assessment based on a 4-parameter logistic regression model
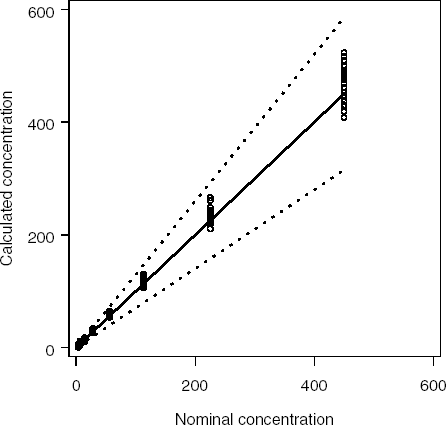
Figure 4.4 plots the raw concentrations versus the corresponding back-calculated concentrations. The solid line is the identity line and, if the method is reasonably unbiased, all data points are expected to cluster around this line. The two dotted lines represent the [−30%,30%] acceptance limits drawn on an absolute scale. If the precision of a method is satisfactory, most data points should lie between the two lines.
Figure 4.4 displays the linearity of the results for the data obtained using the calibration curve of Figure 4.2. The contrast between those two figures highlights clearly the contrast existing between the concepts of linearity of the results and response function of the signals. When chromatographic methods with narrow ranges are envisaged, both the response function and linearity will look linear but, except for this specific case, the two graphs will look different.