 Plotting 3D scatter plots
by Alberto Boschetti, Luca Massaron, Bastiaan Sjardin, John Hearty, Prateek Joshi
Python: Real World Machine Learning
Plotting 3D scatter plots
by Alberto Boschetti, Luca Massaron, Bastiaan Sjardin, John Hearty, Prateek Joshi
Python: Real World Machine Learning
- Python: Real World Machine Learning
- Table of Contents
- Python: Real World Machine Learning
- Python: Real World Machine Learning
- Credits
- Preface
- I. Module 1
- 1. The Realm of Supervised Learning
- Introduction
- Preprocessing data using different techniques
- Label encoding
- Building a linear regressor
- Computing regression accuracy
- Achieving model persistence
- Building a ridge regressor
- Building a polynomial regressor
- Estimating housing prices
- Computing the relative importance of features
- Estimating bicycle demand distribution
- 2. Constructing a Classifier
- Introduction
- Building a simple classifier
- Building a logistic regression classifier
- Building a Naive Bayes classifier
- Splitting the dataset for training and testing
- Evaluating the accuracy using cross-validation
- Visualizing the confusion matrix
- Extracting the performance report
- Evaluating cars based on their characteristics
- Extracting validation curves
- Extracting learning curves
- Estimating the income bracket
- 3. Predictive Modeling
- 4. Clustering with Unsupervised Learning
- Introduction
- Clustering data using the k-means algorithm
- Compressing an image using vector quantization
- Building a Mean Shift clustering model
- Grouping data using agglomerative clustering
- Evaluating the performance of clustering algorithms
- Automatically estimating the number of clusters using DBSCAN algorithm
- Finding patterns in stock market data
- Building a customer segmentation model
- 5. Building Recommendation Engines
- Introduction
- Building function compositions for data processing
- Building machine learning pipelines
- Finding the nearest neighbors
- Constructing a k-nearest neighbors classifier
- Constructing a k-nearest neighbors regressor
- Computing the Euclidean distance score
- Computing the Pearson correlation score
- Finding similar users in the dataset
- Generating movie recommendations
- 6. Analyzing Text Data
- Introduction
- Preprocessing data using tokenization
- Stemming text data
- Converting text to its base form using lemmatization
- Dividing text using chunking
- Building a bag-of-words model
- Building a text classifier
- Identifying the gender
- Analyzing the sentiment of a sentence
- Identifying patterns in text using topic modeling
- 7. Speech Recognition
- 8. Dissecting Time Series and Sequential Data
- Introduction
- Transforming data into the time series format
- Slicing time series data
- Operating on time series data
- Extracting statistics from time series data
- Building Hidden Markov Models for sequential data
- Building Conditional Random Fields for sequential text data
- Analyzing stock market data using Hidden Markov Models
- 9. Image Content Analysis
- Introduction
- Operating on images using OpenCV-Python
- Detecting edges
- Histogram equalization
- Detecting corners
- Detecting SIFT feature points
- Building a Star feature detector
- Creating features using visual codebook and vector quantization
- Training an image classifier using Extremely Random Forests
- Building an object recognizer
- 10. Biometric Face Recognition
- Introduction
- Capturing and processing video from a webcam
- Building a face detector using Haar cascades
- Building eye and nose detectors
- Performing Principal Components Analysis
- Performing Kernel Principal Components Analysis
- Performing blind source separation
- Building a face recognizer using Local Binary Patterns Histogram
- 11. Deep Neural Networks
- Introduction
- Building a perceptron
- Building a single layer neural network
- Building a deep neural network
- Creating a vector quantizer
- Building a recurrent neural network for sequential data analysis
- Visualizing the characters in an optical character recognition database
- Building an optical character recognizer using neural networks
- 12. Visualizing Data
- 1. The Realm of Supervised Learning
- II. Module 2
- 1. Unsupervised Machine Learning
- 2. Deep Belief Networks
- 3. Stacked Denoising Autoencoders
- 4. Convolutional Neural Networks
- 5. Semi-Supervised Learning
- 6. Text Feature Engineering
- 7. Feature Engineering Part II
- 8. Ensemble Methods
- 9. Additional Python Machine Learning Tools
- A. Chapter Code Requirements
- III. Module 3
- 1. First Steps to Scalability
- 2. Scalable Learning in Scikit-learn
- 3. Fast SVM Implementations
- 4. Neural Networks and Deep Learning
- The neural network architecture
- Neural networks and regularization
- Neural networks and hyperparameter optimization
- Neural networks and decision boundaries
- Deep learning at scale with H2O
- Deep learning and unsupervised pretraining
- Deep learning with theanets
- Autoencoders and unsupervised learning
- Summary
- 5. Deep Learning with TensorFlow
- 6. Classification and Regression Trees at Scale
- 7. Unsupervised Learning at Scale
- 8. Distributed Environments – Hadoop and Spark
- 9. Practical Machine Learning with Spark
- A. Introduction to GPUs and Theano
- A. Bibliography
- Index
In this recipe, we will learn how to plot 3D scatterplots and visualize them in three dimensions.
- Create a new Python file, and import the following packages:
import numpy as np
import matplotlib.pyplot as plt
from mpl_toolkits.mplot3d import Axes3D
- Create the empty figure:
# Create the figure
fig = plt.figure()
ax = fig.add_subplot(111, projection='3d')
- Define the number of values that we should generate:
# Define the number of values
n = 250
- Create a
lambdafunction to generate values in a given range:# Create a lambda function to generate the random values in the given range f = lambda minval, maxval, n: minval + (maxval - minval) * np.random.rand(n)
- Generate X, Y, and Z values using this function:
# Generate the values
x_vals = f(15, 41, n)
y_vals = f(-10, 70, n)
z_vals = f(-52, -37, n)
- Plot these values:
# Plot the values ax.scatter(x_vals, y_vals, z_vals, c='k', marker='o') ax.set_xlabel('X axis') ax.set_ylabel('Y axis') ax.set_zlabel('Z axis') plt.show() - The full code is in the
scatter_3d.pyfile that's already provided to you. If you run this code, you will see the following figure: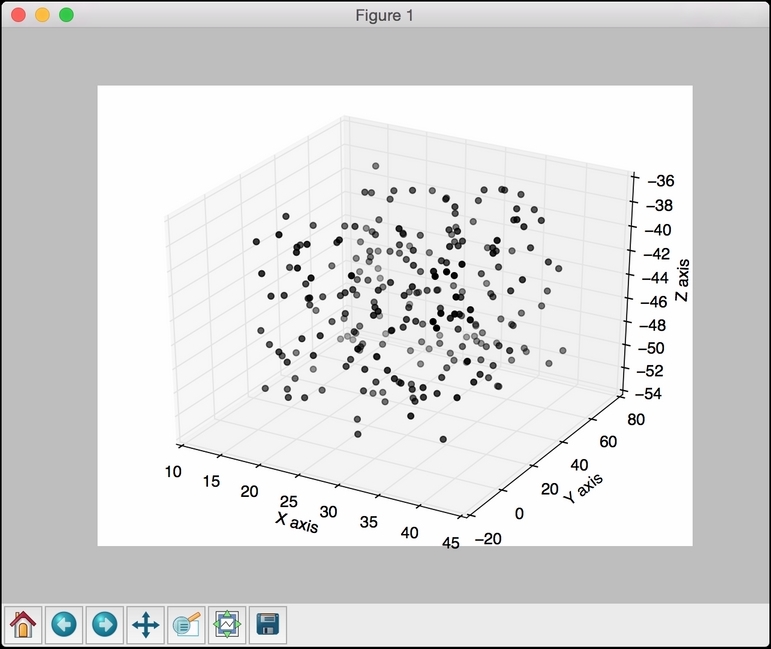
-
No Comment
..................Content has been hidden....................
You can't read the all page of ebook, please click here login for view all page.