
Blind source separation refers to the process of separating signals from a mixture. Let's say a bunch of different signal generators generate signals and a common receiver receives all of these signals. Now, our job is to separate these signals from this mixture using the properties of these signals. We will use Independent Components Analysis (ICA) to achieve this. You can learn more about it at http://www.mit.edu/~gari/teaching/6.555/LECTURE_NOTES/ch15_bss.pdf. Let's see how to do it.
- Create a new Python file, and import the following packages:
import numpy as np
import matplotlib.pyplot as plt
from scipy import signal

from sklearn.decomposition import PCA, FastICA
- We will use data from the
mixture_of_signals.txtfile that's already provided to you. Let's load the data:# Load data input_file = 'mixture_of_signals.txt' X = np.loadtxt(input_file)
- Create the ICA object:
# Compute ICA
ica = FastICA(n_components=4)
- Reconstruct the signals, based on ICA:
# Reconstruct the signals
signals_ica = ica.fit_transform(X)
- Extract the mixing matrix:
# Get estimated mixing matrix
mixing_mat = ica.mixing_
- Perform PCA for comparison:
# Perform PCA
pca = PCA(n_components=4)
signals_pca = pca.fit_transform(X)  # Reconstruct signals based on orthogonal components
- Define the list of signals to plot them:
# Specify parameters for output plots
models = [X, signals_ica, signals_pca]
- Specify the colors of the plots:
colors = ['blue', 'red', 'black', 'green']
- Plot the input signal:
# Plotting input signal plt.figure() plt.title('Input signal (mixture)') for i, (sig, color) in enumerate(zip(X.T, colors), 1): plt.plot(sig, color=color) - Plot the ICA-separated signals:
# Plotting ICA signals plt.figure() plt.title('ICA separated signals') plt.subplots_adjust(left=0.1, bottom=0.05, right=0.94, top=0.94, wspace=0.25, hspace=0.45) - Plot the subplots with different colors:
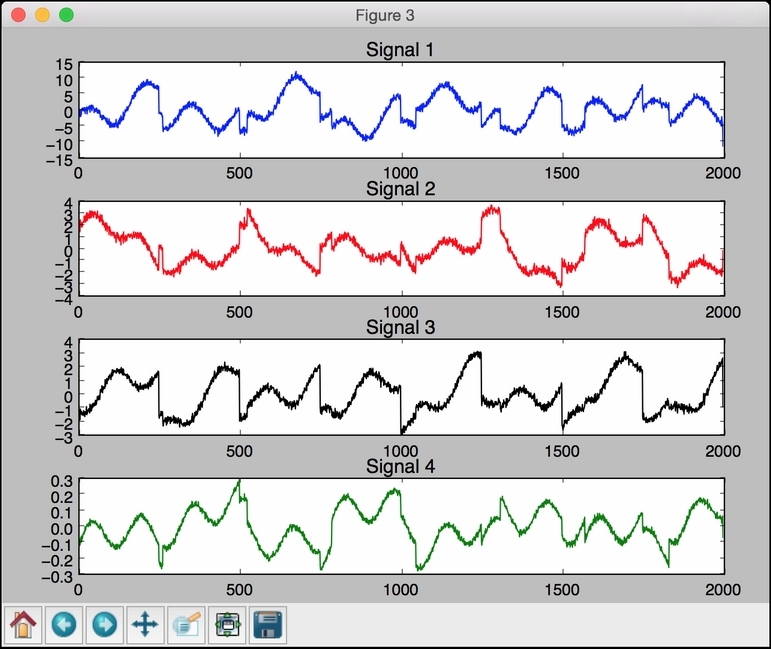
for i, (sig, color) in enumerate(zip(signals_ica.T, colors), 1): plt.subplot(4, 1, i) plt.title('Signal ' + str(i)) plt.plot(sig, color=color) - Plot the PCA-separated signals:
# Plotting PCA signals plt.figure() plt.title('PCA separated signals') plt.subplots_adjust(left=0.1, bottom=0.05, right=0.94, top=0.94, wspace=0.25, hspace=0.45) - Use a different color in each subplot:
for i, (sig, color) in enumerate(zip(signals_pca.T, colors), 1): plt.subplot(4, 1, i) plt.title('Signal ' + str(i)) plt.plot(sig, color=color) plt.show() - The full code is given in the
blind_source_separation.pyfile that's already provided to you for reference. If you run this code, you will see three figures. The first figure depicts the input, which is a mixture of signals:
The second figure depicts the signals, separated using ICA:

The third figure depicts the signals, separated using PCA:
..................Content has been hidden....................
You can't read the all page of ebook, please click here login for view all page.