
One of the main reasons that we want to analyze time series data is to extract interesting statistics from it. This provides a lot of information regarding the nature of the data. In this recipe, we will take a look at how to extract these stats.
- Create a new Python file, and import the following packages:
import numpy as np
import pandas as pd
import matplotlib.pyplot as plt

from convert_to_timeseries import convert_data_to_timeseries
- We will use the same text file that we used in the previous recipes for analysis:
# Input file containing data
input_file = 'data_timeseries.txt'
- Load both the data columns (third and fourth columns):
# Load data
data1 = convert_data_to_timeseries(input_file, 2)
data2 = convert_data_to_timeseries(input_file, 3)
- Create a pandas data structure to hold this data. This dataframe is like a dictionary that has keys and values:
dataframe = pd.DataFrame({'first': data1, 'second': data2}) - Let's start extracting some stats now. To extract the maximum and minimum values, use the following code:
# Print max and min
print '
Maximum:
', dataframe.max()
print '
Minimum:
', dataframe.min()
- To print the mean values of your data or just the row-wise mean, use the following code:
# Print mean
print '
Mean:
', dataframe.mean()
print '
Mean row-wise:
', dataframe.mean(1)[:10]
- The rolling mean is an important statistic that's used a lot in time series processing. One of the most famous applications is smoothing a signal to remove noise. Rolling mean refers to computing the mean of a signal in a window that keeps sliding on the time scale. Let's consider a window size of
24and plot this, as follows:# Plot rolling mean pd.rolling_mean(dataframe, window=24).plot()
- Correlation coefficients are useful in understanding the nature of the data, as follows:
# Print correlation coefficients
print '
Correlation coefficients:
', dataframe.corr()
- Let's plot this using a window size of
60:# Plot rolling correlation plt.figure() pd.rolling_corr(dataframe['first'], dataframe['second'], window=60).plot() plt.show()
- The full code is given in the
extract_stats.pyfile that is already provided to you. If you run the code, the rolling mean will look like the following: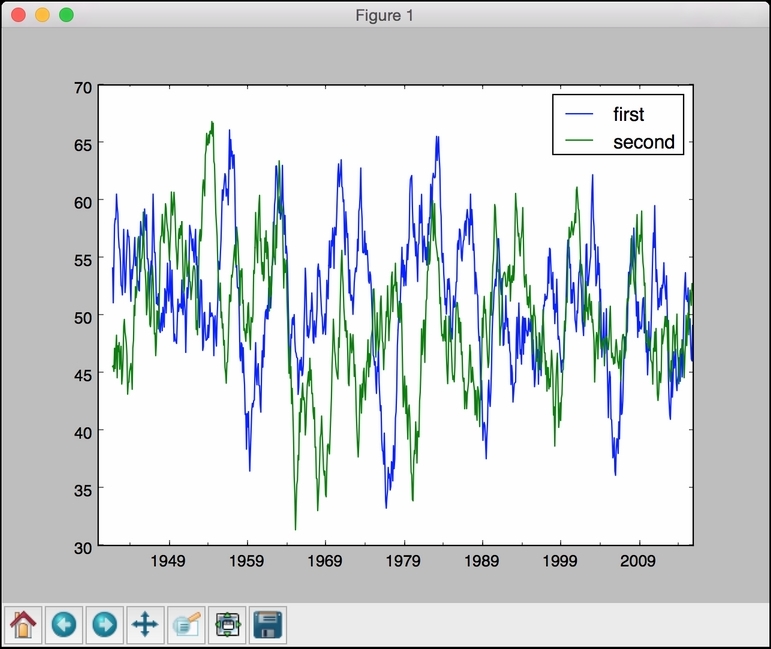
- The second output figure indicates the rolling correlation:

- In the upper half of the Terminal, you will see max, min, and mean values printed, as shown in the following image:

- In the lower half of the Terminal, you will see the row-wise mean stats and correlation coefficients printed, as seen in the following image:

..................Content has been hidden....................
You can't read the all page of ebook, please click here login for view all page.