Let's see how we can use unsupervised learning for stock market analysis. We will operate with the assumption that we don't know how many clusters there are. As we don't know the number of clusters, we will use an algorithm called Affinity Propagation to cluster. It tries to find a representative datapoint for each cluster in our data. It tries to find measures of similarity between pairs of datapoints and considers all our datapoints as potential representatives, also called exemplars, of their respective clusters. You can learn more about it at http://www.cs.columbia.edu/~delbert/docs/DDueck-thesis_small.pdf
In this recipe, we will analyze the stock market variations of companies in a specified duration of time. Our goal is to then find out what companies behave similarly in terms of their quotes over time.
- The full code for this recipe is given in the
stock_market.pyfile that's already provided to you. Let's look at how it's built. Create a new Python file, and import the following packages:import json import datetime import numpy as np import matplotlib.pyplot as plt from sklearn import covariance, cluster from matplotlib.finance import quotes_historical_yahoo_ochl as quotes_yahoo
- We need a file that contains all the symbols and the associated names. This information is located in the
symbol_map.jsonfile provided to you. Let's load this, as follows:# Input symbol file symbol_file = 'symbol_map.json'
- Let's read the data from the symbol map file:
# Load the symbol map with open(symbol_file, 'r') as f: symbol_dict = json.loads(f.read()) symbols, names = np.array(list(symbol_dict.items())).T - Let's specify a time period for the purpose of this analysis. We will use these start and end dates to load the input data:
# Choose a time period
start_date = datetime.datetime(2004, 4, 5)
end_date = datetime.datetime(2007, 6, 2)
- Let's read the input data:
quotes = [quotes_yahoo(symbol, start_date, end_date, asobject=True) for symbol in symbols] - As we need some feature points for analysis, we will use the difference between the opening and closing quotes every day to analyze the data:
# Extract opening and closing quotes
opening_quotes = np.array([quote.open for quote in quotes]).astype(np.float)
closing_quotes = np.array([quote.close for quote in quotes]).astype(np.float)

# The daily fluctuations of the quotes
delta_quotes = closing_quotes - opening_quotes
- Let's build a graph model:
# Build a graph model from the correlations
edge_model = covariance.GraphLassoCV()
- We need to standardize the data before we use it:
# Standardize the data
X = delta_quotes.copy().T
X /= X.std(axis=0)
- Let's train the model using this data:
# Train the model with np.errstate(invalid='ignore'): edge_model.fit(X) - We are now ready to build the clustering model:
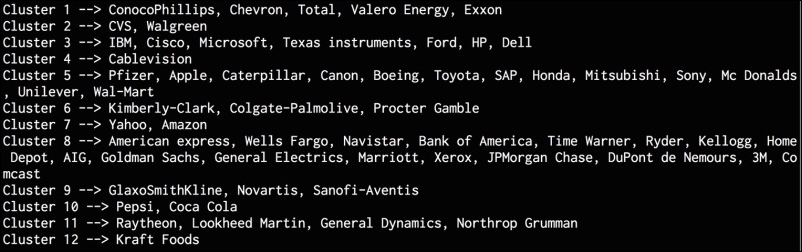
# Build clustering model using affinity propagation _, labels = cluster.affinity_propagation(edge_model.covariance_) num_labels = labels.max() # Print the results of clustering for i in range(num_labels + 1): print "Cluster", i+1, "-->", ', '.join(names[labels == i]) - If you run this code, you will get the following output on the Terminal: